Sidebar 4: Measurements
All of the measurements, unless otherwise noted, were made at the 0dB gain setting of the filters. The actual measured gain for this balanced input/output configuration, however, was just under 6dB on both crossover legs. The input impedance of the Bryston 10B measured 33k ohms (within less than ±1k ohm) in both channels. Its output impedance measured 200 ohms (+3, –0 ohms) in either channel of the high- and low-pass legs.
Fig.1 shows the frequency responses of the two crossover legs with a 400Hz crossover frequency—the same used by Steven Stone—with slopes of 6, 12, and 18dB/octave. Note that the 3dB-down point here is at the specified 400Hz crossover. A complete set of curves for all the available crossover points, at 6dB/octave, is plotted in fig.2.
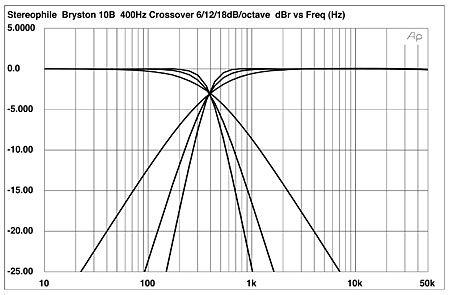 Fig.1 Bryston 10B, high- and low-pass output responses with slopes set to 6dB, 12dB, and 18dB/octave and crossover frequency set to 400Hz (5dB/vertical div.).
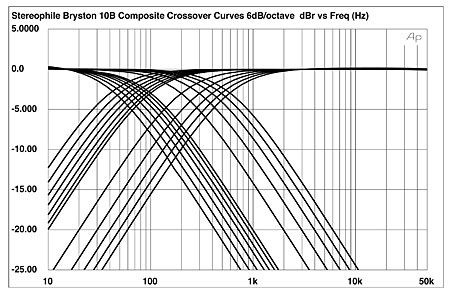 Fig.2 Bryston 10B, overall high- and low-pass output responses with slopes set to 6dB/octave (5dB/vertical div.).
The crosstalk for both the high- and low-pass legs for the same 400Hz, 6dB/octave setting is shown in fig.3. In this case, we've extended the range of the curves to three octaves above and two octaves below crossover. This is excellent performance. The crosstalk increases at higher frequencies (due to capacitive coupling between the channels), but remains quite low.
Fig.2 Bryston 10B, overall high- and low-pass output responses with slopes set to 6dB/octave (5dB/vertical div.).
The crosstalk for both the high- and low-pass legs for the same 400Hz, 6dB/octave setting is shown in fig.3. In this case, we've extended the range of the curves to three octaves above and two octaves below crossover. This is excellent performance. The crosstalk increases at higher frequencies (due to capacitive coupling between the channels), but remains quite low.
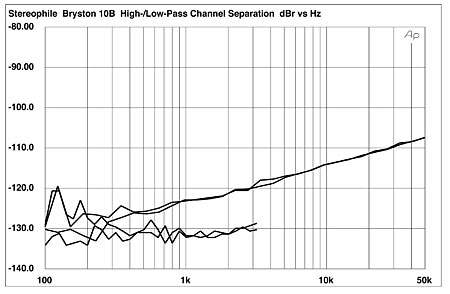 Fig.3 Bryston 10B, high-pass (top) and low-pass crosstalk, set to 400Hz and 6dB/octave (bottom) (10dB/vertical div.).
Finally, the THD+noise vs frequency for both crossover legs, again at 400Hz, 6dB/octave, may be seen in fig.4. Note here that the plots have been made only up to the crossover point. While the measured distortion rises as we enter the stop-bands of the filters, that increase is not significant, and its absolute value still remains small. Also not shown are THD+noise curves for the available higher and lower gain settings; for both the +5dB and –5dB maximum and minimum gain settings, the distortion change in the pass-bands relative to the 0dB readings was negligible. Even into the stop-bands, the distortion change at higher and lower gains was not significant.
Fig.3 Bryston 10B, high-pass (top) and low-pass crosstalk, set to 400Hz and 6dB/octave (bottom) (10dB/vertical div.).
Finally, the THD+noise vs frequency for both crossover legs, again at 400Hz, 6dB/octave, may be seen in fig.4. Note here that the plots have been made only up to the crossover point. While the measured distortion rises as we enter the stop-bands of the filters, that increase is not significant, and its absolute value still remains small. Also not shown are THD+noise curves for the available higher and lower gain settings; for both the +5dB and –5dB maximum and minimum gain settings, the distortion change in the pass-bands relative to the 0dB readings was negligible. Even into the stop-bands, the distortion change at higher and lower gains was not significant.
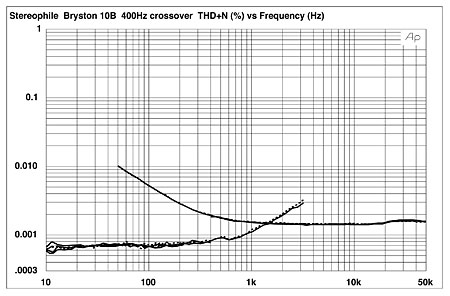 Fig.4 Bryston 10B, high- and low-pass THD+noise vs frequency, set to 400Hz and 6dB/octave (right channel dashed).
From a test-bench perspective, the 10B—except for the rolloffs inherent in its function as a crossover network—is as transparent as is possible at the current state of the art.—Thomas J. Norton
Fig.4 Bryston 10B, high- and low-pass THD+noise vs frequency, set to 400Hz and 6dB/octave (right channel dashed).
From a test-bench perspective, the 10B—except for the rolloffs inherent in its function as a crossover network—is as transparent as is possible at the current state of the art.—Thomas J. Norton
Fig.1 Bryston 10B, high- and low-pass output responses with slopes set to 6dB, 12dB, and 18dB/octave and crossover frequency set to 400Hz (5dB/vertical div.).
Fig.2 Bryston 10B, overall high- and low-pass output responses with slopes set to 6dB/octave (5dB/vertical div.).
The crosstalk for both the high- and low-pass legs for the same 400Hz, 6dB/octave setting is shown in fig.3. In this case, we've extended the range of the curves to three octaves above and two octaves below crossover. This is excellent performance. The crosstalk increases at higher frequencies (due to capacitive coupling between the channels), but remains quite low.
Fig.3 Bryston 10B, high-pass (top) and low-pass crosstalk, set to 400Hz and 6dB/octave (bottom) (10dB/vertical div.).
Fig.4 Bryston 10B, high- and low-pass THD+noise vs frequency, set to 400Hz and 6dB/octave (right channel dashed).
From a test-bench perspective, the 10B—except for the rolloffs inherent in its function as a crossover network—is as transparent as is possible at the current state of the art.—Thomas J. Norton


