Sidebar 3: Measurements
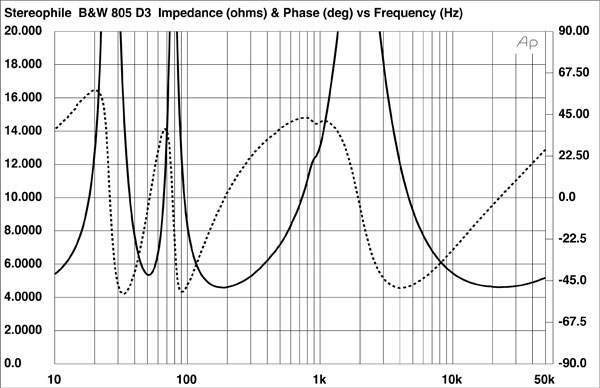
I used DRA Labs' MLSSA system and a calibrated DPA 4006 microphone to measure the Bowers & Wilkins 805 D3's frequency response in the farfield, and an Earthworks QTC-40 for the nearfield and in-room responses. The B&W's voltage sensitivity is specified as 88dB/2.83V/m; my estimate was slightly higher than this, at 88.4dB(B). The nominal impedance is 8 ohms; the solid trace in fig.1 reveals that the magnitude drops below 8 ohms between 100 and 750Hz and above 8kHz, with minima of 4.6 ohms at 180Hz and 22kHz. The electrical phase angle (fig.1, dotted trace) is occasionally extreme, with combinations of 6 ohms and –35° at 118Hz and 8.2kHz. Tube amplifiers will probably work best with this speaker when used from their 4 ohm output-transformer taps.
 The impedance-magnitude trace suggests that the large, flared port on the front baffle is tuned to 50Hz or so. The minimum-motion notch in the woofer's nearfield output (fig.3, blue trace) occurs at 48Hz, and the port's response (red) peaks between 35 and 90Hz in classic fashion. (I haven't plotted the port's output above 500Hz, as the measurement at higher frequencies was contaminated by the woofer's output.) The woofer's response is relatively even (though with a couple of small peaks and dips visible) up to 3.3kHz, where it crosses over to the tweeter (green trace). The crossover filter slopes appear to be low-order, as the complementary rolloffs of the two drive-units are initially gentle. The tweeter is balanced up to 5dB too high in level on its axis, but the primary dome resonance, and the usual dip below that resonance by a tweeter with a stiff, pistonic diaphragm, are both above the audioband.
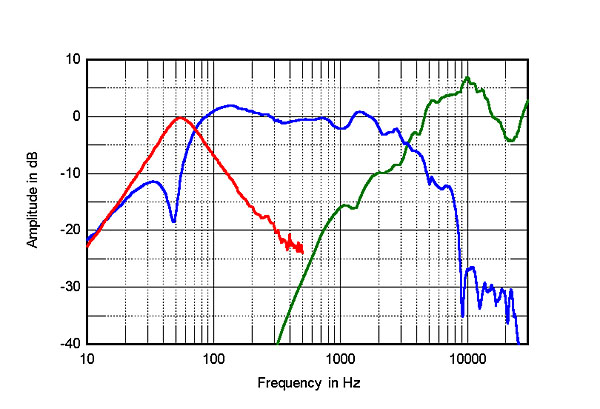
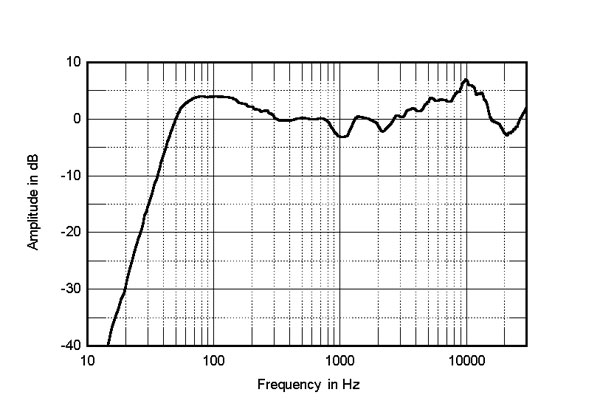
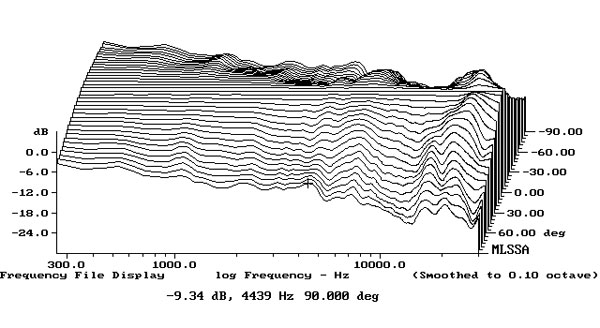
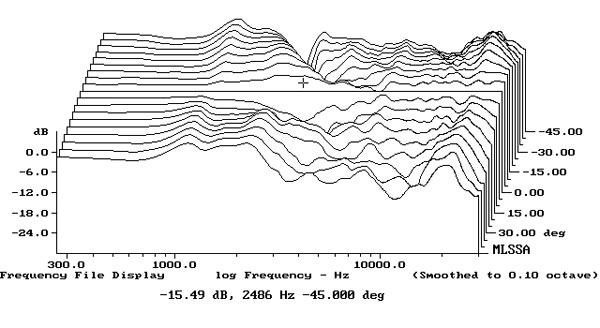
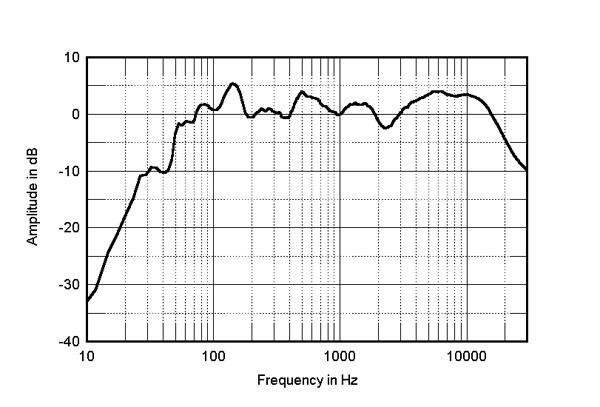
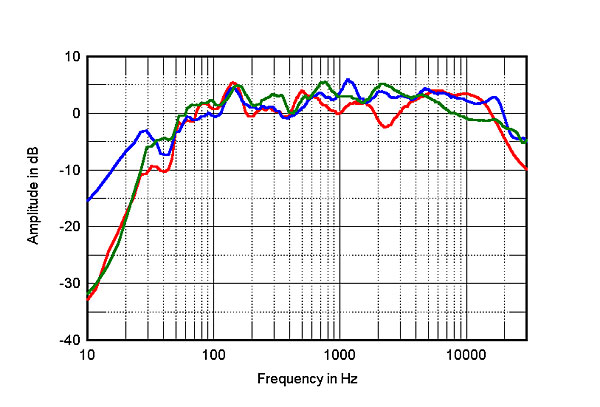
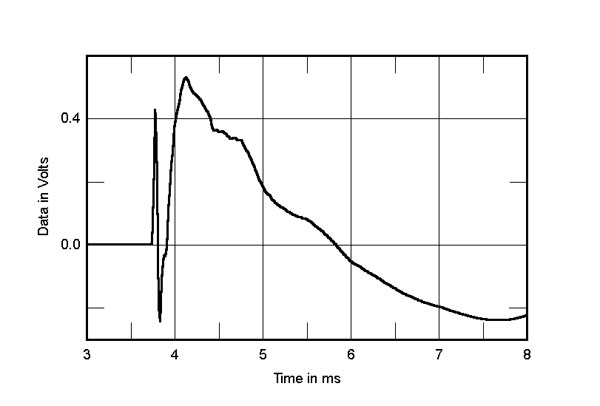
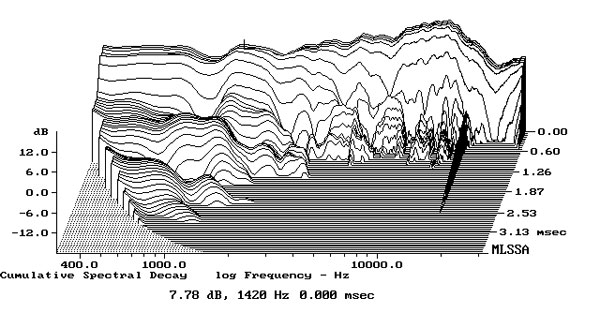
Fig.1 Bowers & Wilkins 805 D3, electrical impedance (solid) and phase (dashed) (2 ohms/vertical div.).
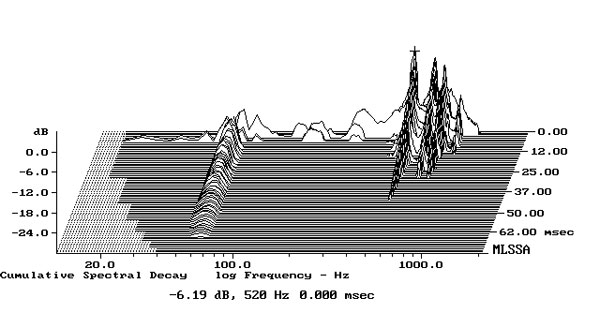
Although it probably can't be seen at the scale this graph is printed in the magazine, there is a very slight discontinuity around 900Hz in the impedance traces. However, when I investigated the enclosure's vibrational behavior with a simple plastic-tape accelerometer I found no major problems in this region, though I did find a moderately strong mode on the curved sidewalls at 520Hz, and two lower-level modes at higher frequencies (fig.2).
Fig.2 Bowers & Wilkins 805 D3, cumulative spectral-decay plot calculated from output of accelerometer fastened to center of sidewall (MLS driving voltage to speaker, 7.55V; measurement bandwidth, 2kHz).
Fig.3 Bowers & Wilkins 805 D3, acoustic crossover on tweeter axis at 50", corrected for microphone response, with nearfield responses of woofer (blue) and port (red), respectively plotted in the ratios of the square roots of their radiating areas below 300 and 500Hz.
The elevated tweeter output in the top two audio octaves can be seen in the 805 D3's farfield output, averaged across a 30° horizontal window (fig.4), and a couple of small suckouts are visible in the upper midrange and low treble. The apparent rise in the upper bass in this graph is an artifact of the nearfield measurement technique.
Fig.4 Bowers & Wilkins 805 D3, anechoic response on tweeter axis at 50", averaged across 30° horizontal window and corrected for microphone response, with complex sum of nearfield woofer and port responses plotted below 300Hz.
The plot of the B&W's lateral dispersion, normalized to the tweeter-axis response (fig.5), has impressively even contour lines—other than a well-controlled reduction in level, the speaker's balance doesn't change in an aggressive manner to its sides up to 8kHz or so, when the tweeter's increased directivity makes its presence known. Vertically, the use of low-order crossover filters means that a large suckout develops in the crossover region 5° below and 10° above the tweeter axis (fig.6).
Fig.5 Bowers & Wilkins 805 D3, lateral response family at 50", normalized to response on tweeter axis, from back to front: differences in response 90–5° off axis, reference response, differences in response 5–90° off axis.
Fig.6 Bowers & Wilkins 805 D3, vertical response family at 50", normalized to response on tweeter axis, from back to front: differences in response 45–5° above axis, reference response, differences in response 5–45° below axis.
Fig.7 shows the B&W 805 D3's spatially averaged response in my room. (I average 20 1/6-octave–smoothed spectra, individually taken for the left and right speakers using SMUGSoftware's FuzzMeasure 3.0 program and a 96kHz sample rate, in a rectangular grid 36" wide by 18" high and centered on the positions of my ears. This mostly eliminates the room acoustic's effects.) The balance is not as smooth as that of the Aerial 5T, which I also reviewed for this issue, and there is both a slight lack of energy in the presence region and a slightly boosted mid-treble.
Fig.7 Bowers & Wilkins 805 D3, spatially averaged, 1/6-octave response in JA's listening room.
The red trace in fig.8 is again the spatially averaged response of the 805 D3 in my room. The excess of mid-treble energy is apparent when compared both with the BBC LS3/5a (blue trace) and the KEF LS50 (green), both measured under identical conditions. However, the B&W lacks the LS3/5a's small peak between 1 and 2kHz, which adds a touch of nasality to that vintage speaker's sound. The LS50's in-room response shelves down in the top octaves compared with the B&W; in that respect the KEF's in-room behavior resembles that of the Aerial 5T. Both speakers sound less "brilliant" than the B&W, but I believe this is actually more neutral in-room behavior, given the increased absorptivity of the room furnishings in the high treble. The 805 D3 has a little more upper bass than the LS3/5a, but, like the KEF, its ported alignment results in a faster rolloff below the midbass.
Fig.8 Bowers & Wilkins 805 D3, spatially averaged, 1/6-octave response in JA's listening room (red); of KEF LS50 (green); and of BBC LS3/5a (blue).
Turning to the time domain, the Bowers & Wilkins' step response on the tweeter axis (fig.9) reveals that both drive-units are connected in positive acoustic polarity, but with the tweeter's output leading that of the woofer. In fact, the very slight discontinuity just before the 4ms mark suggests that the drive-units blend best if the listener's ears are slightly below the tweeter axis—although, as fig.5 showed, if you sit much lower, a suckout develops in the crossover region. The cumulative spectral-decay or waterfall plot on the tweeter axis (fig.10) reveals a superb lack of delayed energy across the audioband.
Fig.9 Bowers & Wilkins 805 D3, step response on tweeter axis at 50" (5ms time window, 30kHz bandwidth).
Fig.10 Bowers & Wilkins 805 D3, cumulative spectral-decay plot on tweeter axis at 50" (0.15ms risetime).
The B&W 805 D3's measured performance indicates that it has a somewhat "tailored" frequency response in the treble, but in all other respects there is nothing amiss.—John Atkinson