Sidebar 3: Measurements
For logistical reasons, I measured one of the 801 D4 Signature speakers, serial number 2320 0004094 FP 44229, in Tom Fine's listening room rather than at my home. (My thanks to Tom and Mike Barney for moving furniture to allow me sufficient room for the measurements with the loudspeaker away from the walls and firing along a room diagonal.) I used DRA Labs' MLSSA system with a calibrated DPA 4006 microphone to measure the speaker's behavior in the farfield and an Earthworks QTC-40 mike for the nearfield responses. Because of the speaker's weight—almost 222lb—it wasn't possible to raise it off the floor. I therefore performed all the farfield measurements at a 1m microphone distance rather than my usual 50" to push back in time the reflections of the speaker's output from the floor. The measurements were performed with the vestigial grilles in place, as this was how TF had auditioned the 801 D4 Signatures.
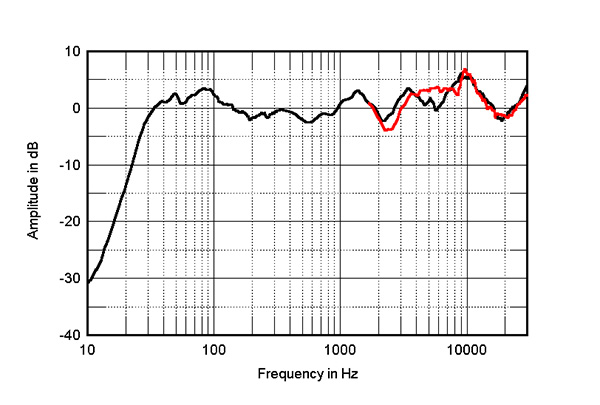
The black trace above 300Hz in fig.4 shows the B&W's farfield response, averaged across a 30° horizontal window centered on the tweeter axis. The red trace repeats the averaged response on the midrange axis. The overall balance on either axis favors the treble, with a slight lack of presence-region energy compared with the output above and below that region. I repeated the tweeter-axis response measurement with the Earthworks microphone, which is flat up to 40kHz, and MLSSA set to its maximum sample rate. There was no sign of the tweeter's fundamental dome resonance—in the measurements Paul Miller performed for Stereophile's sister magazine Hi-Fi News, this resonance lay just below 50kHz (footnote 2).
The 801 D4 Signature's measured performance indicates that the treble balance is on the bright side of neutral, which might be exaggerated by the lack of energy at the top of the woofers' passband and in the presence region. But I was impressed by the extremely quiet enclosures and the extended low frequencies.—John Atkinson
Footnote 1: EPDR is the resistive load that gives rise to the same peak dissipation in an amplifier's output devices as the loudspeaker. See "Audio Power Amplifiers for Loudspeaker Loads," JAES, Vol.42 No.9, September 1994, and stereophile.com/reference/707heavy/index.html. Footnote 2: PM's measured response is also very similar what I show in fig.4.
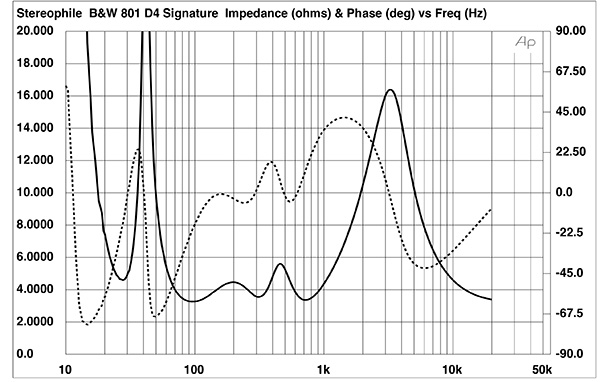
Fig.1 Bowers & Wilkins 801 D4 Signature, electrical impedance (solid) and phase (dashed) (2 ohms/vertical div.).
B&W specifies the 801 D4 Signature's sensitivity as 90dB/2.83V/m, which was confirmed by my estimate of 89.8dB(B)/2.83V/m. I measured the loudspeaker's impedance with Dayton Audio's DATS V2 system. The 801 D4 Signature's impedance magnitude (fig.1, solid trace) lies between 3.5 ohms and 6 ohms through the upper bass and midrange, with a minimum value of 3.2 ohms at 90Hz. (The specified minimum impedance is 3 ohms.) However, the electrical phase angle (fig.1, dashed trace) is often high, meaning that the EPDR (footnote 1), or effective impedance, lies below 2 ohms between 52Hz and 107Hz and below 3 ohms between 310Hz and 418Hz, between 60Hz and 1750Hz, and above 5.5kHz. The minimum EPDR values are 1.24 ohms at 72Hz, 2.3 ohms at 362Hz, 1.62 ohms at 912Hz, and 1.82 ohms at 10.6kHz. The 801 D4 Signature has one of the most current-hungry impedances I have encountered, though this will be somewhat ameliorated by the above-average voltage sensitivity.
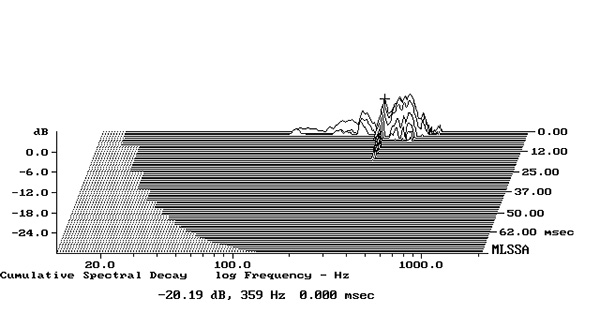
Fig.2 Bowers & Wilkins 801 D4 Signature, cumulative spectral-decay plot calculated from output of accelerometer fastened to the side of the woofer enclosure (MLS driving voltage to speaker, 7.55V; measurement bandwidth, 2kHz).
I investigated the woofer and midrange enclosure's vibrational behavior with a plastic-tape accelerometer. When I rapped the woofer enclosure's sidewalls with my knuckles, I heard a slight "plink" with a stethoscope, which correlated with a very low-level mode at 359Hz (fig.2). The midrange enclosure was completely inert.
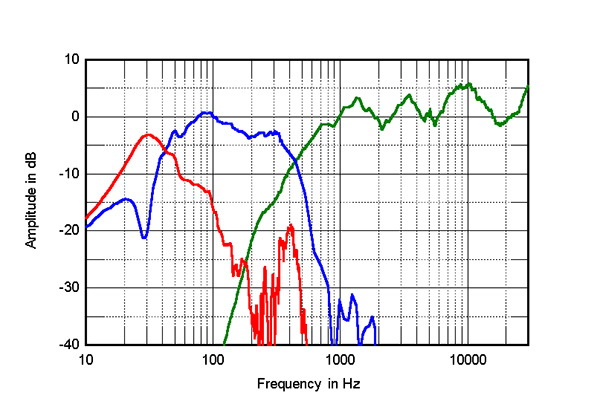
Fig.3 Bowers & Wilkins 801 D4 Signature, acoustic crossover on tweeter axis at 1m, corrected for microphone response, with nearfield midrange (green), woofer (blue) and port (red) responses respectively plotted below 440Hz, 440Hz, and 550Hz.
The impedance-magnitude plot has a saddle centered on a low 28.5Hz, which suggests that this is the tuning frequency of the downward-firing port on the woofer cabinet's base. The two woofers behaved identically; the blue trace below 440Hz in fig.3 shows the sum of their nearfield responses, which has its minimum-motion notch at the expected 28.5Hz. The nearfield response of the port (red trace) peaks between 20Hz and 50Hz, and its initial upper-frequency rolloff is very clean. While there is a peak centered on 400Hz in its output, this lies 20dB below the peak output of the woofers. The woofers cross over to the midrange unit (green trace) just above the specified 400Hz, with a fast low-pass rolloff. The farfield output of the midrange unit and tweeter (green trace above 440Hz) appears to be balanced 3–5dB higher in level than that of the woofers and is relatively uneven, with a triple-humped response.
The black trace below 300Hz in fig.4 shows the sum of the nearfield midrange, woofer, and port outputs taking into account acoustic phase and the different distance of each radiator from a nominal farfield microphone position. The rise in response in the upper bass, which is due to the nearfield measurement technique, is lower in amplitude than usual. The 801 D4 Signature's low-frequency alignment appears to be optimized for definition; with the low tuning frequency of the port, boundary reinforcement will give extension to below 20Hz in a typical room. (B&W specifies the –6dB frequency as 13Hz.)
Fig.4 Bowers & Wilkins 801 D4 Signature, anechoic response, averaged across 30° horizontal window on tweeter axis at 1m (black) and on midrange axis (red), both corrected for microphone response, with the complex sum of the nearfield midrange, woofer, and port responses plotted below 300Hz.
Bowers & Wilkins doesn't specify a recommended listening axis, so I took the farfield responses in figs.3 and 4 on the tweeter axis. However, as the tweeter is 47" from the floor and TF's ears with him sitting in his chair were closer to the midrange axis, which is 41.5" high, I performed response and lateral dispersion tests on both the tweeter axis and the midrange axis.
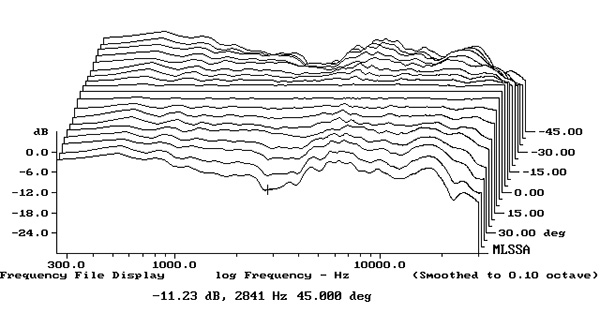
Fig.5 Bowers & Wilkins 801 D4 Signature, lateral response family at 1m, normalized to response on tweeter axis, from back to front: differences in response 45–5° off axis, reference response, differences in response 5–45° off axis.
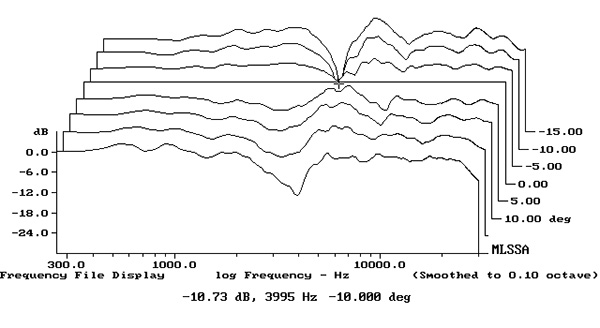
Fig.6 Bowers & Wilkins 801 D4 Signature, vertical response family at 1m, normalized to response on tweeter axis, from back to front: differences in response 15–5° above axis, reference response, differences in response 5–20° below axis.
The 801 D4 Signature's horizontal dispersion, normalized to the tweeter-axis response, is shown in fig.5. (Even though the speaker was firing along the room's diagonal, the geometric limitations of TF's room meant that I could only measure the differences in response up to 45° from each side of the speaker instead of my usual 90°.) The lack of presence-region energy on-axis is accentuated to the speaker's sides, but the contour lines in this graph are otherwise even, implying stable stereo imaging. In the vertical plane (fig.6), a suckout develops at 4kHz 10° above the tweeter axis, which confirms the upper crossover frequency. However, as also shown by the red trace in fig.4, there is more mid-treble energy below the tweeter axis.
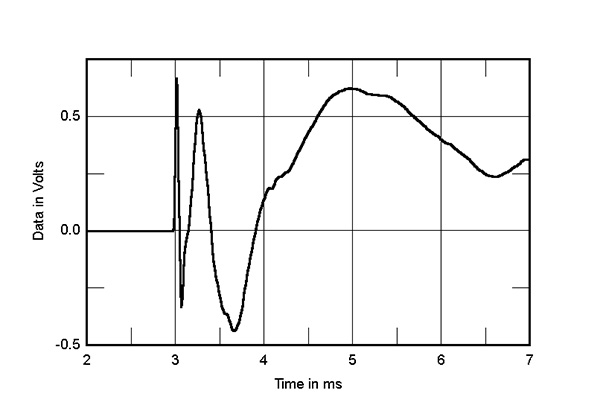
Fig.7 Bowers & Wilkins 801 D4 Signature, step response on tweeter axis at 1m (5ms time window, 30kHz bandwidth).
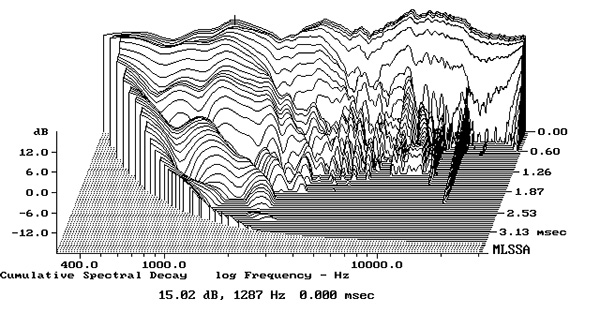
Fig.8 Bowers & Wilkins 801 D4 Signature, cumulative spectral-decay plot on tweeter axis at 1m (0.15ms risetime).
The 801 D4 Signature's step response (fig.7) indicates that all four drive units are connected in positive acoustic polarity. The tweeter's output arrives first at the microphone, and the decay of its step blends smoothly with the start of the midrange unit's step. The decay of the midrange step then blends smoothly with the start of the woofers' step. The B&W's cumulative spectral-decay plot (fig.8) is clean in the region covered by the tweeter, though some low-level delayed energy is present in the treble. There is also some delayed energy associated with the on-axis peak just above 1kHz.
Footnote 1: EPDR is the resistive load that gives rise to the same peak dissipation in an amplifier's output devices as the loudspeaker. See "Audio Power Amplifiers for Loudspeaker Loads," JAES, Vol.42 No.9, September 1994, and stereophile.com/reference/707heavy/index.html. Footnote 2: PM's measured response is also very similar what I show in fig.4.


