Sidebar 3: Measurements
I measured one of the Arendal 1528 Tower 8 loudspeakers, serial number 1521BA251552, with DRA Labs' MLSSA system, a calibrated DPA 4006 microphone for the farfield frequency behavior and dispersion, and an Earthworks QTC-40 mike for the nearfield responses. I measured the 1528 Tower 8's impedance magnitude and electrical phase angle with Dayton Audio's DATS V2 system.
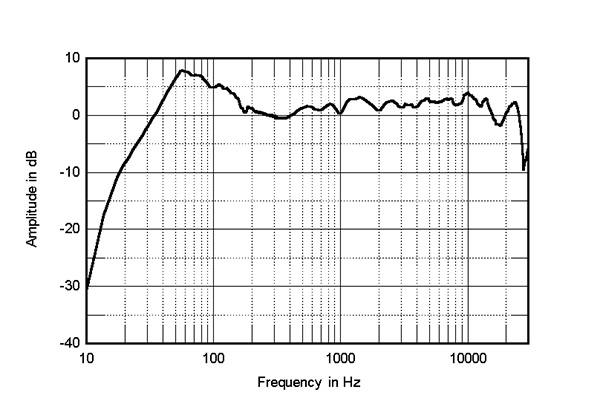
The black trace above 300Hz in fig.5 shows the 1528 Tower 8's quasi-anechoic farfield response, averaged across a 30° horizontal window centered on the tweeter axis. With the speaker supported by its feet this axis is 50" from the floor, which is significantly higher than a listener's typical ear height, which a survey Stereophile performed in the 1990s found was 36". The Arendal loudspeaker's manual goes into detail about what the optimal listening axis should be: "The speaker's acoustic center, located between the tweeter and midrange [driver], should be angled toward the ear level; ... as a reference, the optimal listening height for the 1528 Tower 8 is 98cm (38.6") at a 4m distance." I therefore repeated the farfield response measurements, again averaged across a 30° horizontal window, on the recommended axis, which was 43" from the floor. It was basically identical to that shown in fig.5; the response on both axes was even in the treble but with a slight lack of energy in the midrange.
Footnote 1: EPDR is the resistive load that gives rise to the same peak dissipation in an amplifier's output devices as the loudspeaker. See "Audio Power Amplifiers for Loudspeaker Loads," JAES, Vol.42 No.9, September 1994, and stereophile.com/reference/707heavy/index.html.
Footnote 2: This means that the loudspeaker is firing into hemispherical space rather than a full sphere. A speaker that has a truly flat response in the usual "4pi" space will therefore appear to have a boosted upper-bass output with a nearfield measurement, the center frequency of that boost depending on the physical dimensions of the speaker and the woofer alignment. See stereophile.com/content/measuring-loudspeakers-part-three-page-6 or aes2.org/publications/elibrary-page/?id=7171. The nearfield measurement and a truly anechoic measurement are what is called "limiting cases." The speaker's in-room low-frequency behavior will be somewhere between these extremes, depending on the size of the room.
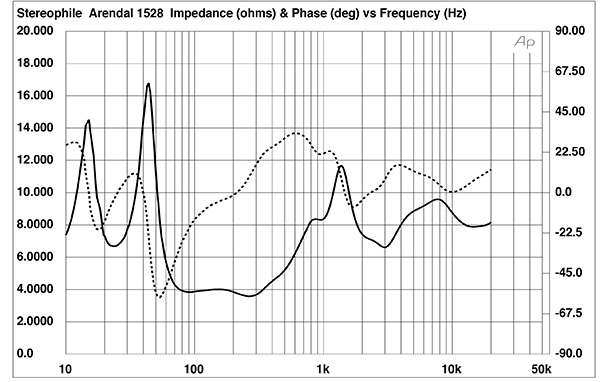
Fig.1 Arendal 1528 Tower 8, port open, electrical impedance (solid) and phase (dashed) (2 ohms/vertical div.).
Arendal specifies the 1528 Tower 8's anechoic sensitivity as 89.5dB/2.83V/1m. My B-weighted estimate was within experimental error of the specification, at 89dB(B)/2.83V/1m. Fig.1 shows the impedance magnitude (solid trace) and electrical phase angle (dashed trace), taken with the downward-facing port open and the HF and Mid level adjustment jumpers on the speaker's rear panel plugged into the central, Reference positions. The nominal impedance is specified as 4 ohms; the magnitude is close to 4 ohms in the midrange and upper bass but is closer to 8 ohms in the treble. The minimum value is 3.6 ohms at 290Hz. However, as the electrical phase angle is occasionally high, the effective resistance, or EPDR (footnote 1), drops below 3 ohms between 50Hz and 135Hz and between 241Hz and 704Hz. The minimum EPDR values are 1.53 ohms at 68Hz and 2 ohms from 332Hz to 362Hz. As music can have high energy in these regions, the 1528 Tower 8 is a demanding amplifier load.
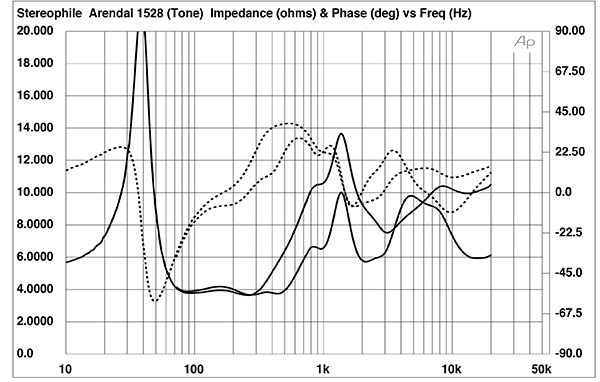
Fig.2 Arendal 1528 Tower 8, port closed, electrical impedance (solid) and phase (dashed) with HF and Mid jumpers set to +2dB and –2dB (2 ohms/vertical div.).
Fig.2 shows the impedance magnitude and electrical phase angle with the port blocked and the HF and Mid jumpers on the speaker's rear panel plugged into the +2dB and –2dB positions. The sealed-box woofer tuning frequency is indicated by the magnitude peak at 38Hz, and the EPDR drops below 2 ohms between 52Hz and 90Hz. While the magnitude is higher in the treble with the jumpers set to –2dB, the EPDR still lies below 3 ohms in the middle of the midrange.
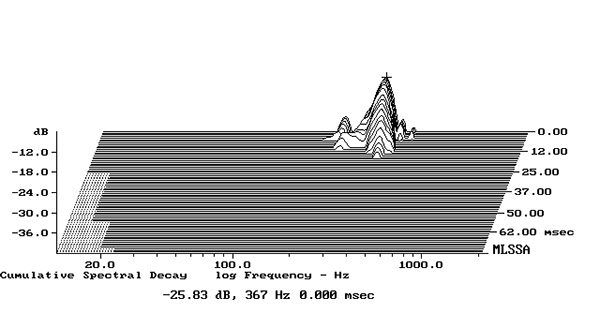
Fig.3 Arendal 1528 Tower 8, cumulative spectral-decay plot calculated from output of accelerometer fastened to center of sidewall (measurement bandwidth, 2kHz).
The traces in figs.1 and 2 are free from the small discontinuities in the midrange that would indicate the existence of cabinet resonances of various kinds, and the large enclosure seemed inert when I rapped its walls with my knuckles. When I investigated the Arendal's vibrational behavior with a plastic-tape accelerometer, the only resonant mode I found lay at 367Hz, on the centers of the sidewalls (fig.3). However, this mode is extremely low in level and has a high Q (Quality Factor), both of which mean it won't have audible consequences.
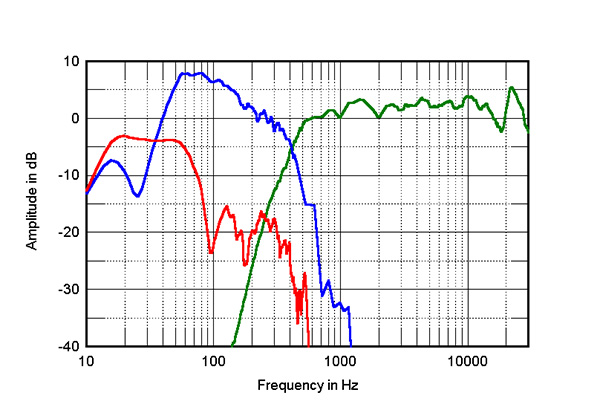
Fig.4 Arendal 1528 Tower 8, farfield response on tweeter axis at 50", corrected for microphone response, with the nearfield responses of the midrange unit (green), woofers (blue), and port (red), respectively plotted below 500Hz, 450Hz, and 550Hz.
The saddle centered at 25Hz in the magnitude trace in fig.1 indicates that the tuning frequency of the port on the speaker's base lies in this region. The red trace in fig.4 shows the port's nearfield response; its output reaches its maximum at the tuning frequency but extends an octave higher in frequency before rolling off. The rolloff is initially clean, though there are some low-level peaks present in the midrange. As the port faces the floor, these peaks should not affect sound quality. The four woofers behaved identically; the sum of their nearfield responses (fig.4, blue trace below 450Hz) has the expected minimum-motion notch at the port tuning frequency. Their midbass output peaks higher than I usually find with a nearfield measurement, which assumes that the drive units are mounted in a true infinite baffle (footnote 2).
Fig.5 Arendal 1528 Tower 8, anechoic response on tweeter axis at 50", averaged across 30° horizontal window and corrected for microphone response, with the complex sum of the nearfield responses plotted below 300Hz.
The woofers cross over to the midrange unit (fig.4, green trace) at the specified 420Hz, with high-order crossover slopes. The farfield response of the midrange unit and tweeter, measured on the tweeter axis (green trace above 500Hz), is even throughout the treble. The complex sum of the woofer and port responses (black trace below 300Hz in fig.5) repeats the rise in the midbass response seen in fig.4. The speaker offers extended low frequencies, and compensating for the nearfield boost, its output will be down by 6dB at the port tuning frequency of 25Hz.
Fig.6 Arendal 1528 Tower 8, effect on the farfield response on the optimal axis with the HF and Mid level adjustment jumpers plugged into the +2dB and –2dB positions (5dB/vertical div.)
I then measured the farfield response on the optimal axis with the HF and Mid level adjustment jumpers on the speaker's rear panel plugged into the +2dB and –2dB positions (fig.6). The maximum boost and cut was close to ±2.5dB rather than ±2dB over most of the audioband, but fell to +1dB/–1.5dB in the crossover region between the midrange unit and tweeter.
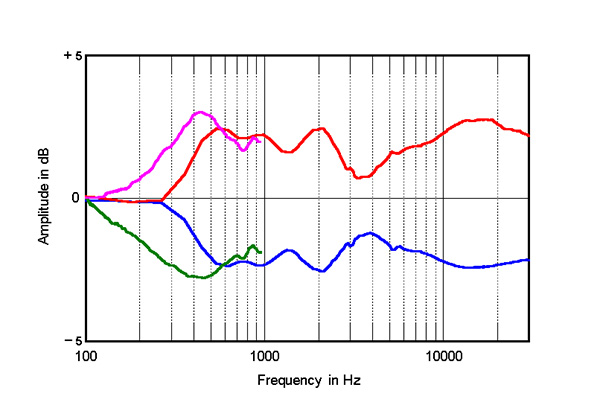
Fig.7 Arendal 1528 Tower 8, lateral response family at 50", normalized to response on tweeter axis, from back to front: differences in response 60–5° off axis, reference response, differences in response 5–60° off axis.
Fig.8 Arendal 1528 Tower 8, vertical response family at 50", normalized to response on tweeter axis, from back to front: differences in response 15–5° above axis, reference response, differences in response 5–15° below axis.
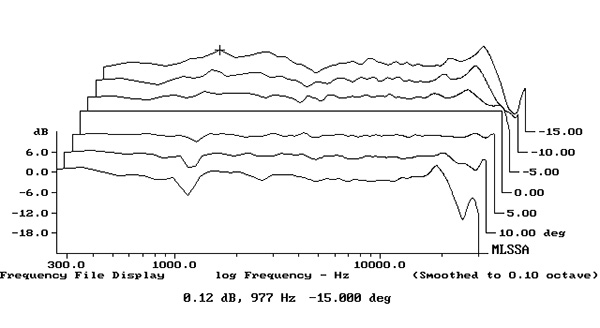
Fig.7 shows the 1528 Tower 8's horizontal dispersion, normalized to the response on the tweeter axis, which thus appears as a straight line. (As I had had to place the 174lb speaker on a small wheeled dolly for the measurements rather than my computer-controlled Outline turntable, it wasn't possible to measure the off-axis response more than 60° to each side of the tweeter axis.) The radiation pattern is even and well-controlled, which correlates with accurate, stable stereo imaging. The Arendal's radiation pattern in the vertical plane, again normalized to the tweeter-axis response, is shown in fig.8. Despite the caution in the manual, the loudspeaker's response doesn't change appreciably over a wide +5°/–10° angle.
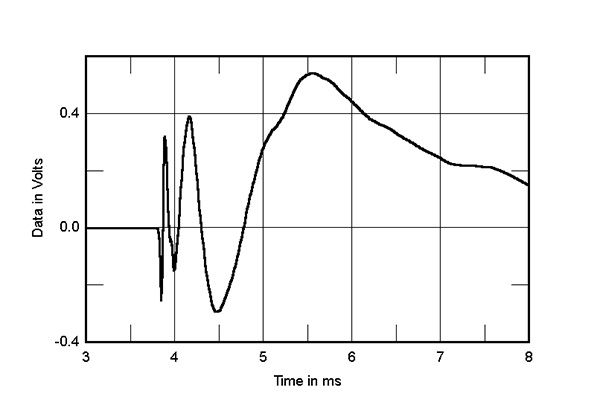
Fig.9 Arendal 1528 Tower 8, step response on tweeter axis at 50" (5ms time window, 30kHz bandwidth).
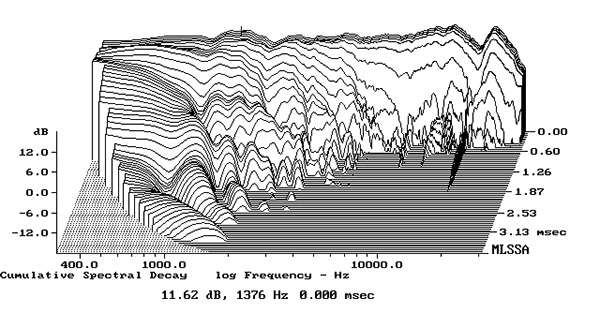
Fig.10 Arendal 1528 Tower 8, cumulative spectral-decay plot on tweeter axis at 50" (0.15ms risetime).
In the time domain, the 1528 Tower 8's step response (fig.9) indicates that the tweeter is connected in inverted acoustic polarity, the midrange unit and woofers in positive polarity. The tweeter's negative-going output arrives first at the microphone, the decay of its step blending with the start of the midrange unit's. (This graph was taken on the tweeter axis; the small discontinuity just before the arrival of the midrange unit's positive-going step confirms that the optimal axis is just below the tweeter axis.) The decay of the midrange unit's step smoothly blends with the start of the woofers' step, which implies an optimal crossover topology. The 1528 Tower 8's cumulative spectral-decay plot (fig.10) is clean overall, though some low-level delayed energy is present at the top of the midrange unit's passband.
Overall, the Arendal 1528 Tower 8 offers excellent measured performance, with an inert enclosure, an even frequency response, and well-controlled dispersion. Its extended, powerful low frequencies will need care in setup, however, and that demanding effective impedance will also require care in choosing an appropriate amplifier.—John Atkinson
Footnote 1: EPDR is the resistive load that gives rise to the same peak dissipation in an amplifier's output devices as the loudspeaker. See "Audio Power Amplifiers for Loudspeaker Loads," JAES, Vol.42 No.9, September 1994, and stereophile.com/reference/707heavy/index.html.


