| Columns Retired Columns & Blogs |
VTL ST-85 power amplifier Measurements part 2
The percentage of THD+noise vs frequency results (at 1kHz) plotted in fig.4 indicate reasonably low readings (by tube amplifier standards) across the audio band. The 1kHz THD+noise waveform is shown in fig.5 (at 2W into a 4 ohm load). The result is heavily second-harmonic. At 4W into 2 ohms (not shown) there is clear evidence of higher-order harmonics, but the second harmonic is still dominant.
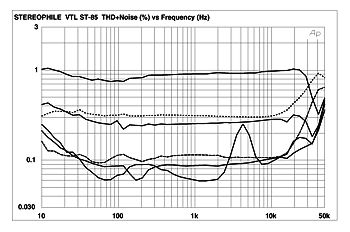
Fig.4 VTL ST-85, THD+noise vs frequency at (from top to bottom at 1kHz): 4W into 2 ohms, 2W into 4 ohms, 1W into 8 ohms, and 2.83V into simulated loudspeaker load.
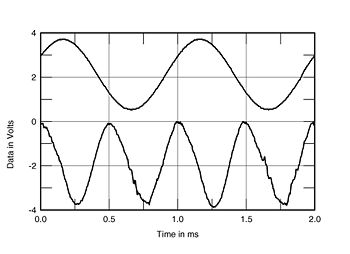
Fig.5 VTL ST-85, 1kHz waveform at 2W into 4 ohms (top), distortion and noise waveform with fundamental notched out (bottom, not to scale).
Fig.6 shows the output spectrum with a 50Hz input at 57W into 4 ohms, 2/3-rated power. The largest artifact at this frequency is the third harmonic, at -39.5dB (about 1% THD), with the higher-order harmonics still significant but progressively decreasing in level. Fig.7 shows a similar spectral plot, here the result of a combined 19+20kHz signal. The residual indicates the sum-and-difference tones created by the amplifier with these frequencies at the input—in other words, the intermodulation between these two tones. The reading was taken at an output of 47W into 4 ohms (at higher power, visible clipping is evident in the waveform with this input signal). The IM component at 1kHz is at -49.4dB (about 0.35%), and the most prominent artifact is -43.5dB (0.7%) at 18kHz. The distortion results for a 37W output into 8 ohms are not shown, but are generally marginally lower—and, at at least one frequency (16kHz), significantly so.
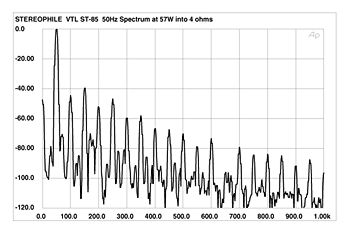
Fig.6 VTL ST-85, spectrum of 50Hz sinewave, DC-1kHz, at 57W into 4 ohms (linear frequency scale).
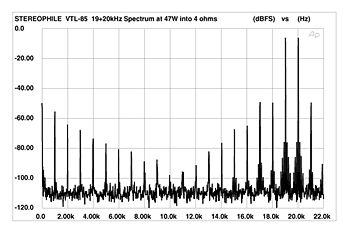
Fig.7 VTL ST-85, HF intermodulation spectrum, DC-22kHz, 19+20kHz at 47W into 4 ohms (linear frequency scale).
- Log in or register to post comments
