Sidebar 3: Measurements
My estimate of the Vandersteen 2Ce Signature II's voltage sensitivity was 84dB(B)/2.83V/m, which is significantly below average. Its impedance, however, remained between 6 and 8 ohms over almost the entire audioband (fig.1), the only exception being the mid-treble with the treble control set its maximum position, when the impedance dropped to 5 ohms at 6.2kHz and 9kHz. The electrical phase angle is also close to 0° over most of the audioband, meaning that the Vandersteen will be an easy load for an amplifier to drive. This will compensate, to some extent, for its low sensitivity.
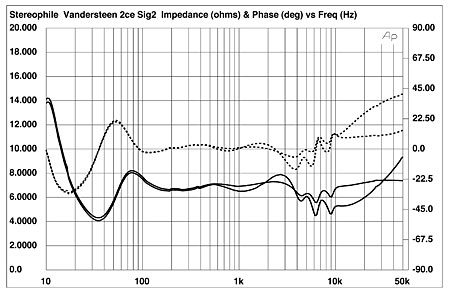 Fig.1 Vandersteen 2Ce Signature II, electrical impedance (solid) and phase (dashed) with tone controls set to their maximum (bottom traces) and minimum (top traces) positions (2 ohms/vertical div.).
The cloth-covered design of the 2Ce made it impossible for me to fasten my usual accelerometer to the cabinet to search for panel resonances. Listening to it with a stethoscope, however, revealed nothing untoward.
I usually measure a loudspeaker's frequency response on its tweeter axis, which is almost always where the designer has intended the individual drive-unit outputs to sum in-phase. Measuring the Vandersteen on this axis, however, produced a significant suckout centered around 4kHz, which I suspect is the frequency at which the tweeter crosses over to the midrange unit. The speaker's plot of vertical dispersion (fig.2) showed that this suckout filled in below the tweeter axis, so I performed almost all the remaining measurements on the midrange axis, which is also where the speaker produced the most time-coherent step response (see later). However, unless the Vandersteen is used on its bases, this axis is just 31" from the floor—a little low for most chairs, which place the average listener's ears at a height of 36".
Fig.1 Vandersteen 2Ce Signature II, electrical impedance (solid) and phase (dashed) with tone controls set to their maximum (bottom traces) and minimum (top traces) positions (2 ohms/vertical div.).
The cloth-covered design of the 2Ce made it impossible for me to fasten my usual accelerometer to the cabinet to search for panel resonances. Listening to it with a stethoscope, however, revealed nothing untoward.
I usually measure a loudspeaker's frequency response on its tweeter axis, which is almost always where the designer has intended the individual drive-unit outputs to sum in-phase. Measuring the Vandersteen on this axis, however, produced a significant suckout centered around 4kHz, which I suspect is the frequency at which the tweeter crosses over to the midrange unit. The speaker's plot of vertical dispersion (fig.2) showed that this suckout filled in below the tweeter axis, so I performed almost all the remaining measurements on the midrange axis, which is also where the speaker produced the most time-coherent step response (see later). However, unless the Vandersteen is used on its bases, this axis is just 31" from the floor—a little low for most chairs, which place the average listener's ears at a height of 36".
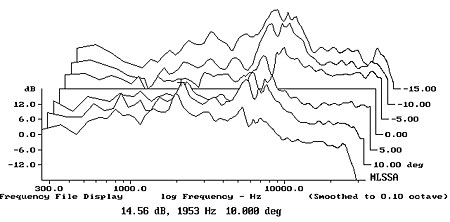 Fig.2 Vandersteen 2Ce Signature II, vertical response family at 50", normalized to response on tweeter axis, from back to front: differences in response 15–5° above axis, reference response, differences in response 5–15° below axis.
The impedance characteristic is a little unusual at low frequencies, being typical of neither a sealed box nor a normal reflex design. The woofer's response (fig.3, red trace) did show the minimum-motion notch of a reflex design, this centered on a low 26Hz, but the output of the rear-facing, mass-loaded "supplementary" woofer (fig.3, green) both peaked a little higher in frequency and rolled off rapidly above 70Hz. The absence of the usual nearfield "bump" in the woofer's upper-bass response suggests that it is tuned to be rather overdamped. The woofer can be seen to cover a very wide passband, its upper –6dB point not occurring until around 2kHz. This results in a broad region of overlap with the midrange unit (fig.3, blue) of almost two octaves. The 2Ce's upper-frequency output is flat, but with a number of small peaks and dips apparent. The usual metal-dome tweeter resonance occurs at a high 27kHz, well above audibility.
Fig.2 Vandersteen 2Ce Signature II, vertical response family at 50", normalized to response on tweeter axis, from back to front: differences in response 15–5° above axis, reference response, differences in response 5–15° below axis.
The impedance characteristic is a little unusual at low frequencies, being typical of neither a sealed box nor a normal reflex design. The woofer's response (fig.3, red trace) did show the minimum-motion notch of a reflex design, this centered on a low 26Hz, but the output of the rear-facing, mass-loaded "supplementary" woofer (fig.3, green) both peaked a little higher in frequency and rolled off rapidly above 70Hz. The absence of the usual nearfield "bump" in the woofer's upper-bass response suggests that it is tuned to be rather overdamped. The woofer can be seen to cover a very wide passband, its upper –6dB point not occurring until around 2kHz. This results in a broad region of overlap with the midrange unit (fig.3, blue) of almost two octaves. The 2Ce's upper-frequency output is flat, but with a number of small peaks and dips apparent. The usual metal-dome tweeter resonance occurs at a high 27kHz, well above audibility.
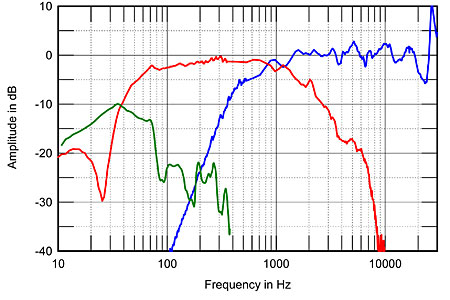 Fig.3 Vandersteen 2Ce Signature II, acoustic crossover on midrange axis at 50" with tone controls set to "0," corrected for microphone response, with the nearfield responses of the supplemental woofer (green), primary woofer (red), and midrange unit (green).
The traces in fig.3 were taken with the midrange and treble controls set to their central, "0" positions, as was the Vandersteen's overall response, averaged across a 30° horizontal window on the midrange axis (fig.4). The treble in this graph seems balanced to be a couple of dB higher in level than the midrange and bass, this accentuated by a slight lack of energy in the middle of the midrange. The speaker offers respectable bass extension, with useful output apparent down to the high 20Hz. Again, however, the absence of the usual upper-bass hump that results from the nearfield measurement technique implies an overdamped woofer alignment that is optimized for clarity and transient attack rather than for weight per se.
Fig.3 Vandersteen 2Ce Signature II, acoustic crossover on midrange axis at 50" with tone controls set to "0," corrected for microphone response, with the nearfield responses of the supplemental woofer (green), primary woofer (red), and midrange unit (green).
The traces in fig.3 were taken with the midrange and treble controls set to their central, "0" positions, as was the Vandersteen's overall response, averaged across a 30° horizontal window on the midrange axis (fig.4). The treble in this graph seems balanced to be a couple of dB higher in level than the midrange and bass, this accentuated by a slight lack of energy in the middle of the midrange. The speaker offers respectable bass extension, with useful output apparent down to the high 20Hz. Again, however, the absence of the usual upper-bass hump that results from the nearfield measurement technique implies an overdamped woofer alignment that is optimized for clarity and transient attack rather than for weight per se.
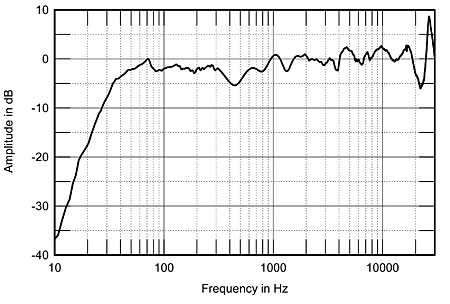 Fig.4 Vandersteen 2Ce Signature II, anechoic response on listening axis at 50" with tone controls set to "0," averaged across 30° horizontal window and corrected for microphone response, with the complex sum of the nearfield responses plotted below 350Hz.
Fig.5 shows the effect of the two tone controls set to their maximum (red trace) and minimum (blue) positions. Both traces are normalized to the tweeter-axis response, so that the differences made by the tone controls stand revealed. The treble control provides a maximum of 6dB cut or boost at 8kHz and a little less at higher frequencies, while the midrange control offers a similar degree of adjustment centered on 3kHz, which is technically in the "presence" region. Perversely, backing off the midrange control actually increases the true midrange level, but by a maximum of only 1dB.
Fig.4 Vandersteen 2Ce Signature II, anechoic response on listening axis at 50" with tone controls set to "0," averaged across 30° horizontal window and corrected for microphone response, with the complex sum of the nearfield responses plotted below 350Hz.
Fig.5 shows the effect of the two tone controls set to their maximum (red trace) and minimum (blue) positions. Both traces are normalized to the tweeter-axis response, so that the differences made by the tone controls stand revealed. The treble control provides a maximum of 6dB cut or boost at 8kHz and a little less at higher frequencies, while the midrange control offers a similar degree of adjustment centered on 3kHz, which is technically in the "presence" region. Perversely, backing off the midrange control actually increases the true midrange level, but by a maximum of only 1dB.
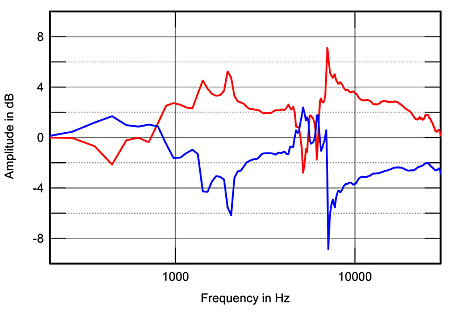 Fig.5 Vandersteen 2Ce Signature II, effect on tweeter-axis response of midrange and treble controls set to their maximum (red) and minimum (blue) positions (2dB/vertical div.).
I haven't shown the 2Ce Signature II's horizontal-dispersion plot because it is very difficult to interpret. It does suggest that the crossover-region suckout on the tweeter-axis response tends to fill in to the speaker's sides, which means that the listener can experiment with toe-in, tilt-back, and the tone controls to get a flat, even balance of the treble and upper midrange. However, the lack of on-axis energy in the middle of the midrange persists off axis. To examine this further, I used Christopher Liscio's FuzzMeasure 2.0 program (SMUG Software) running on my Mac PowerBook to produce a spatially averaged response curve for the 2Ce Signature in my room. FuzzMeasure uses a one-second "chirp" and FFT analysis instead of the continuous pink noise and 1/3-octave spectrum analysis I've used in the past. This is a very much faster means of capturing an in-room response. I captured 20 individual spectra for the left and right speakers individually in a rectangular window centered on the position of my ears in the listening seat; the resulting1/6-octave–smoothed, FFT-derived spectrum is shown in fig.6.
Fig.5 Vandersteen 2Ce Signature II, effect on tweeter-axis response of midrange and treble controls set to their maximum (red) and minimum (blue) positions (2dB/vertical div.).
I haven't shown the 2Ce Signature II's horizontal-dispersion plot because it is very difficult to interpret. It does suggest that the crossover-region suckout on the tweeter-axis response tends to fill in to the speaker's sides, which means that the listener can experiment with toe-in, tilt-back, and the tone controls to get a flat, even balance of the treble and upper midrange. However, the lack of on-axis energy in the middle of the midrange persists off axis. To examine this further, I used Christopher Liscio's FuzzMeasure 2.0 program (SMUG Software) running on my Mac PowerBook to produce a spatially averaged response curve for the 2Ce Signature in my room. FuzzMeasure uses a one-second "chirp" and FFT analysis instead of the continuous pink noise and 1/3-octave spectrum analysis I've used in the past. This is a very much faster means of capturing an in-room response. I captured 20 individual spectra for the left and right speakers individually in a rectangular window centered on the position of my ears in the listening seat; the resulting1/6-octave–smoothed, FFT-derived spectrum is shown in fig.6.
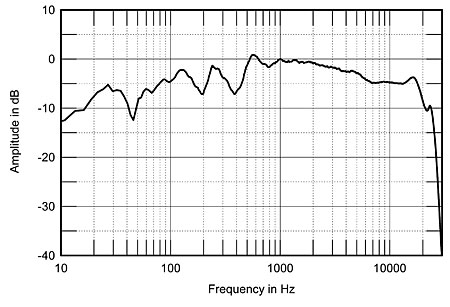 Fig.6 Vandersteen 2Ce Signature II, spatially averaged, 1/6-octave response in JA's listening room.
The bass region in fig.6 offers good extension but is shelved down somewhat. I did have to place the speakers a little farther out in the room for this measurement than would be optimal, which deprived them of some of the usual boundary reinforcement. Even so, the overdamped nature of the woofer alignment will make the Vandersteen sound a bit lean unless care is taken in placement. The upper midrange and treble in this graph are very smooth, with the slight downward tilt of the curve reflecting both the increased amount of room absorption at high frequencies and the tweeter's increasing directivity. The midrange is disturbed by two troughs. The lower-frequency one is, I suspect, due to the Allison Effect, in which the direct sound of the speaker interferes with the reflections from the nearest room boundaries. The upper-frequency trough is a little too high in frequency to be due to the Allison Effect; it is also suspiciously close to the lack of energy seen in the quasi-anechoic response (fig.4).
In the time domain, despite the Vandersteen's multiway design, its impulse response (fig.7) is as time-coherent as that of the single-driver, crossoverless Fujitsu Ten Eclipse TD712z, reviewed elsewhere in this issue. The tail of the impulse also seems very clean, up to the visible glitch just before the 8ms mark, which is the first reflection of the speaker's sound from the area of floor between it and the microphone. The step response (fig.8) also features a time-coherent, right-triangle shape, though there is a rather faster decay than I expected.
Fig.6 Vandersteen 2Ce Signature II, spatially averaged, 1/6-octave response in JA's listening room.
The bass region in fig.6 offers good extension but is shelved down somewhat. I did have to place the speakers a little farther out in the room for this measurement than would be optimal, which deprived them of some of the usual boundary reinforcement. Even so, the overdamped nature of the woofer alignment will make the Vandersteen sound a bit lean unless care is taken in placement. The upper midrange and treble in this graph are very smooth, with the slight downward tilt of the curve reflecting both the increased amount of room absorption at high frequencies and the tweeter's increasing directivity. The midrange is disturbed by two troughs. The lower-frequency one is, I suspect, due to the Allison Effect, in which the direct sound of the speaker interferes with the reflections from the nearest room boundaries. The upper-frequency trough is a little too high in frequency to be due to the Allison Effect; it is also suspiciously close to the lack of energy seen in the quasi-anechoic response (fig.4).
In the time domain, despite the Vandersteen's multiway design, its impulse response (fig.7) is as time-coherent as that of the single-driver, crossoverless Fujitsu Ten Eclipse TD712z, reviewed elsewhere in this issue. The tail of the impulse also seems very clean, up to the visible glitch just before the 8ms mark, which is the first reflection of the speaker's sound from the area of floor between it and the microphone. The step response (fig.8) also features a time-coherent, right-triangle shape, though there is a rather faster decay than I expected.
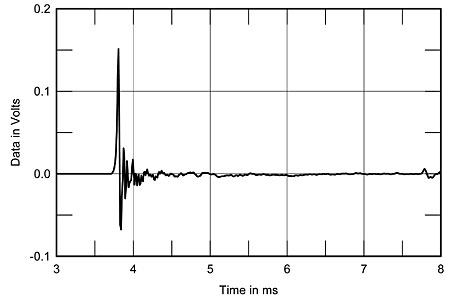 Fig.7 Vandersteen 2Ce Signature II, impulse response on midrange axis at 50" (5ms time window, 30kHz bandwidth).
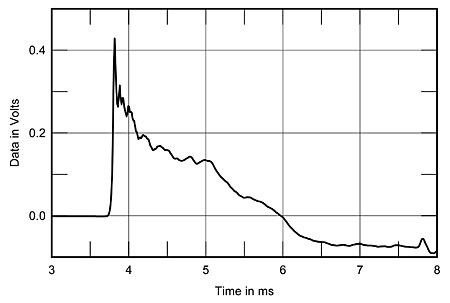 Fig.8 Vandersteen 2Ce Signature II, step response on midrange axis at 50" (5ms time window, 30kHz bandwidth).
I investigated this further by looking at the step responses of the individual drive-unit sections on the midrange axis. These are shown in fig.9: the woofer section's positive step (blue trace) actually overlaps the negative-going overshoot of the tweeter/midrange section's step (red). The latter will tend to cancel the former, leading, I suspect, to the suckout in the middle of the midrange seen in figs.4 and 6. Measuring and listening higher than the midrange axis will move the woofer output back in time with respect to that of the midrange, but then a treble suckout develops between the outputs of the tweeter and the midrange unit. An enigma. I note that AD was not bothered by any midrange response anomalies; it is possible that this behavior looks worse than it sounds.
Fig.8 Vandersteen 2Ce Signature II, step response on midrange axis at 50" (5ms time window, 30kHz bandwidth).
I investigated this further by looking at the step responses of the individual drive-unit sections on the midrange axis. These are shown in fig.9: the woofer section's positive step (blue trace) actually overlaps the negative-going overshoot of the tweeter/midrange section's step (red). The latter will tend to cancel the former, leading, I suspect, to the suckout in the middle of the midrange seen in figs.4 and 6. Measuring and listening higher than the midrange axis will move the woofer output back in time with respect to that of the midrange, but then a treble suckout develops between the outputs of the tweeter and the midrange unit. An enigma. I note that AD was not bothered by any midrange response anomalies; it is possible that this behavior looks worse than it sounds.
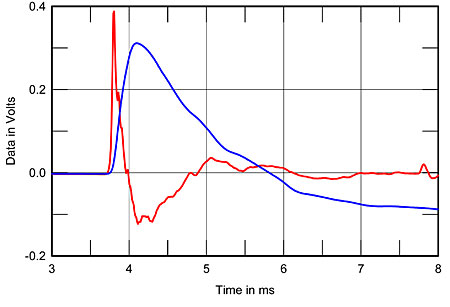 Fig.9 Vandersteen 2Ce Signature II, step responses of tweeter/midrange section (red) and woofer section (blue) on midrange axis at 50" (5ms time window, 30kHz bandwidth).
Finally, the 2Ce Signature II's cumulative spectral-decay plot on its midrange axis (fig.10) shows an extremely clean initial decay, confirming the speaker's time-coherent nature in the upper midrange and treble, though with some delayed hash evident in the mid-treble. This may well be the result of early reflections from the trim above the tweeter.
Fig.9 Vandersteen 2Ce Signature II, step responses of tweeter/midrange section (red) and woofer section (blue) on midrange axis at 50" (5ms time window, 30kHz bandwidth).
Finally, the 2Ce Signature II's cumulative spectral-decay plot on its midrange axis (fig.10) shows an extremely clean initial decay, confirming the speaker's time-coherent nature in the upper midrange and treble, though with some delayed hash evident in the mid-treble. This may well be the result of early reflections from the trim above the tweeter.
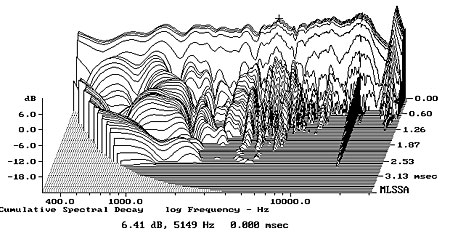 Fig.10 Vandersteen 2Ce Signature II, cumulative spectral-decay plot on midrange axis at 50" (0.15ms risetime).
The Vandersteen 2Ce is one of the best-selling high-end speakers of all time, and most of the measured performance of its Signature II iteration is beyond reproach. I am loath, therefore, to make too much of the lack of integration I noted between its low-frequency and midrange units. But it puzzles me, nevertheless.—John Atkinson
Fig.10 Vandersteen 2Ce Signature II, cumulative spectral-decay plot on midrange axis at 50" (0.15ms risetime).
The Vandersteen 2Ce is one of the best-selling high-end speakers of all time, and most of the measured performance of its Signature II iteration is beyond reproach. I am loath, therefore, to make too much of the lack of integration I noted between its low-frequency and midrange units. But it puzzles me, nevertheless.—John Atkinson
Fig.1 Vandersteen 2Ce Signature II, electrical impedance (solid) and phase (dashed) with tone controls set to their maximum (bottom traces) and minimum (top traces) positions (2 ohms/vertical div.).
The cloth-covered design of the 2Ce made it impossible for me to fasten my usual accelerometer to the cabinet to search for panel resonances. Listening to it with a stethoscope, however, revealed nothing untoward.
Fig.2 Vandersteen 2Ce Signature II, vertical response family at 50", normalized to response on tweeter axis, from back to front: differences in response 15–5° above axis, reference response, differences in response 5–15° below axis.
The impedance characteristic is a little unusual at low frequencies, being typical of neither a sealed box nor a normal reflex design. The woofer's response (fig.3, red trace) did show the minimum-motion notch of a reflex design, this centered on a low 26Hz, but the output of the rear-facing, mass-loaded "supplementary" woofer (fig.3, green) both peaked a little higher in frequency and rolled off rapidly above 70Hz. The absence of the usual nearfield "bump" in the woofer's upper-bass response suggests that it is tuned to be rather overdamped. The woofer can be seen to cover a very wide passband, its upper –6dB point not occurring until around 2kHz. This results in a broad region of overlap with the midrange unit (fig.3, blue) of almost two octaves. The 2Ce's upper-frequency output is flat, but with a number of small peaks and dips apparent. The usual metal-dome tweeter resonance occurs at a high 27kHz, well above audibility.
Fig.3 Vandersteen 2Ce Signature II, acoustic crossover on midrange axis at 50" with tone controls set to "0," corrected for microphone response, with the nearfield responses of the supplemental woofer (green), primary woofer (red), and midrange unit (green).
The traces in fig.3 were taken with the midrange and treble controls set to their central, "0" positions, as was the Vandersteen's overall response, averaged across a 30° horizontal window on the midrange axis (fig.4). The treble in this graph seems balanced to be a couple of dB higher in level than the midrange and bass, this accentuated by a slight lack of energy in the middle of the midrange. The speaker offers respectable bass extension, with useful output apparent down to the high 20Hz. Again, however, the absence of the usual upper-bass hump that results from the nearfield measurement technique implies an overdamped woofer alignment that is optimized for clarity and transient attack rather than for weight per se.
Fig.4 Vandersteen 2Ce Signature II, anechoic response on listening axis at 50" with tone controls set to "0," averaged across 30° horizontal window and corrected for microphone response, with the complex sum of the nearfield responses plotted below 350Hz.
Fig.5 Vandersteen 2Ce Signature II, effect on tweeter-axis response of midrange and treble controls set to their maximum (red) and minimum (blue) positions (2dB/vertical div.).
I haven't shown the 2Ce Signature II's horizontal-dispersion plot because it is very difficult to interpret. It does suggest that the crossover-region suckout on the tweeter-axis response tends to fill in to the speaker's sides, which means that the listener can experiment with toe-in, tilt-back, and the tone controls to get a flat, even balance of the treble and upper midrange. However, the lack of on-axis energy in the middle of the midrange persists off axis. To examine this further, I used Christopher Liscio's FuzzMeasure 2.0 program (SMUG Software) running on my Mac PowerBook to produce a spatially averaged response curve for the 2Ce Signature in my room. FuzzMeasure uses a one-second "chirp" and FFT analysis instead of the continuous pink noise and 1/3-octave spectrum analysis I've used in the past. This is a very much faster means of capturing an in-room response. I captured 20 individual spectra for the left and right speakers individually in a rectangular window centered on the position of my ears in the listening seat; the resulting1/6-octave–smoothed, FFT-derived spectrum is shown in fig.6.
Fig.6 Vandersteen 2Ce Signature II, spatially averaged, 1/6-octave response in JA's listening room.
The bass region in fig.6 offers good extension but is shelved down somewhat. I did have to place the speakers a little farther out in the room for this measurement than would be optimal, which deprived them of some of the usual boundary reinforcement. Even so, the overdamped nature of the woofer alignment will make the Vandersteen sound a bit lean unless care is taken in placement. The upper midrange and treble in this graph are very smooth, with the slight downward tilt of the curve reflecting both the increased amount of room absorption at high frequencies and the tweeter's increasing directivity. The midrange is disturbed by two troughs. The lower-frequency one is, I suspect, due to the Allison Effect, in which the direct sound of the speaker interferes with the reflections from the nearest room boundaries. The upper-frequency trough is a little too high in frequency to be due to the Allison Effect; it is also suspiciously close to the lack of energy seen in the quasi-anechoic response (fig.4).
In the time domain, despite the Vandersteen's multiway design, its impulse response (fig.7) is as time-coherent as that of the single-driver, crossoverless Fujitsu Ten Eclipse TD712z, reviewed elsewhere in this issue. The tail of the impulse also seems very clean, up to the visible glitch just before the 8ms mark, which is the first reflection of the speaker's sound from the area of floor between it and the microphone. The step response (fig.8) also features a time-coherent, right-triangle shape, though there is a rather faster decay than I expected.
Fig.7 Vandersteen 2Ce Signature II, impulse response on midrange axis at 50" (5ms time window, 30kHz bandwidth).
Fig.8 Vandersteen 2Ce Signature II, step response on midrange axis at 50" (5ms time window, 30kHz bandwidth).
I investigated this further by looking at the step responses of the individual drive-unit sections on the midrange axis. These are shown in fig.9: the woofer section's positive step (blue trace) actually overlaps the negative-going overshoot of the tweeter/midrange section's step (red). The latter will tend to cancel the former, leading, I suspect, to the suckout in the middle of the midrange seen in figs.4 and 6. Measuring and listening higher than the midrange axis will move the woofer output back in time with respect to that of the midrange, but then a treble suckout develops between the outputs of the tweeter and the midrange unit. An enigma. I note that AD was not bothered by any midrange response anomalies; it is possible that this behavior looks worse than it sounds.
Fig.9 Vandersteen 2Ce Signature II, step responses of tweeter/midrange section (red) and woofer section (blue) on midrange axis at 50" (5ms time window, 30kHz bandwidth).
Fig.10 Vandersteen 2Ce Signature II, cumulative spectral-decay plot on midrange axis at 50" (0.15ms risetime).
The Vandersteen 2Ce is one of the best-selling high-end speakers of all time, and most of the measured performance of its Signature II iteration is beyond reproach. I am loath, therefore, to make too much of the lack of integration I noted between its low-frequency and midrange units. But it puzzles me, nevertheless.—John Atkinson


