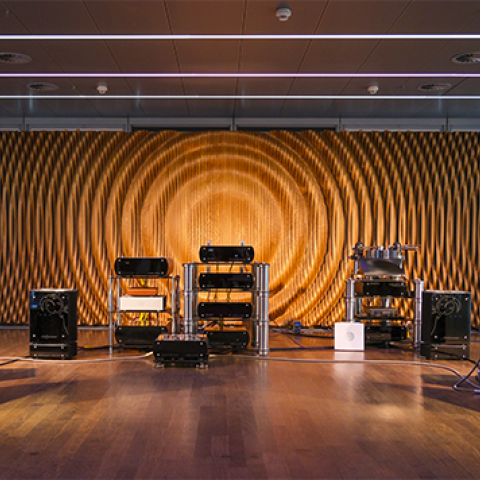
Sidebar 3: Measurements
I used Stereophile's loan sample of the top-of-the-line Audio Precision SYS2722 system (see www.ap.com and the January 2008 "As We See It") to measure the Parasound Halo P 5. Not only is the P 5 a full-function preamplifier with a phono stage, tone controls, and the ability to provide the necessary high- and low-pass crossover functions to enable the use of a subwoofer; it has digital inputs, including USB. Unless stated otherwise, all of my measurements were taken from the unbalanced main outputs.
Looking first at the P 5's behavior as a conventional line preamplifier, the maximum gain is specified as 10dB; for balanced input and balanced output I measured 12.3dB; for unbalanced input and output, the maximum gain was 10.6dB. The unity-gain setting of the volume control for unbalanced operation was 1:00. Both sets of outputs preserve absolute polarity (ie, are non-inverting), with the XLR jacks wired with pin 2 hot. The line input impedance was constant with frequency, at 41k ohms balanced and 23k ohms unbalanced. The balanced output impedance was 897 ohms at 20Hz, 850 ohms at 1 and 20kHz; the unbalanced output impedance was a low 41.5 ohms at 20Hz, dropping to a very low 2.5 ohms in the midrange and treble.
The P 5's line inputs have a very wide frequency response into high impedances (fig.1, blue and red traces), with no sign of any rolloff at the 200kHz limit of this graph, and a low-frequency output down by just 0.25dB at 20Hz. Reducing the load impedance to 600 ohms increased the low-frequency rolloff to –0.85dB at 20Hz (cyan and magenta traces), but it's unlikely the P 5 will see such a low impedance in practice. This graph was generated with the volume set to its maximum, when there was a very slight channel imbalance of 0.05dB. This imbalance disappeared with the volume control set to unity gain; commendably, the preamplifier's frequency response was identical to that in fig.1.


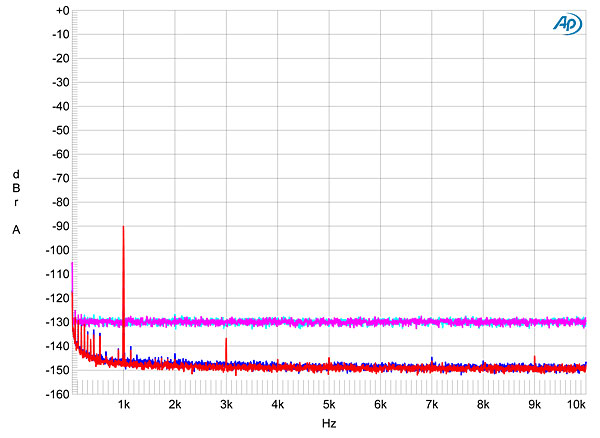
 The cyan and magenta traces in fig.14 were taken with dithered 16-bit data representing a 1kHz tone at –90dBFS. The noise floor is that of the dither and the traces are free from power-supply or distortion-related spuriae. Increasing the bit depth to 24 gave the blue and red traces in this graph, with the noise-floor component now lying about 20dB lower in level than with 16-bit data. This suggests that the P 5's digital section has just over 19 bits of resolution with both S/PDIF and USB data, which is good for a low-priced product. With the good resolution, the P 5's reproduction of an undithered sinewave at exactly –90.31dBFS (fig.15) was excellent, with a symmetrical waveshape and the three DC voltage levels described by the data clearly evident. With 24-bit undithered data (fig.16), the result was a good if slightly noisy sinewave.
 As an analog preamplifier, Parasound's Halo P 5 is well engineered and offers excellent performance at an affordable price. The digital section, however, I feel should be regarded as more of a convenience than offering measured performance that matches that of the analog circuitry.—John Atkinson
Fig.1 Parasound Halo P 5, frequency response with volume control set to maximum at 1V, into: 100k ohms (left channel blue, right red), 600 ohms (left cyan, right magenta) (0.5dB/vertical div.).
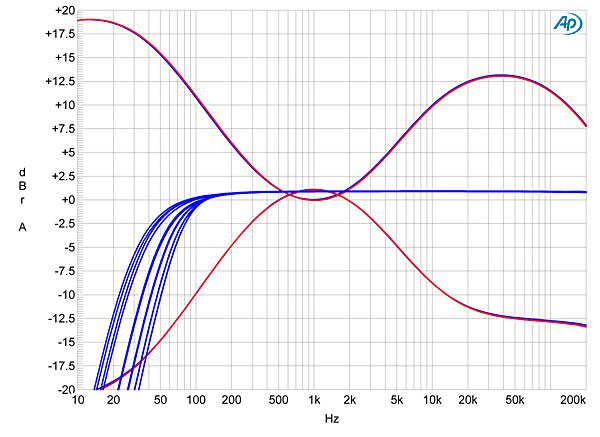
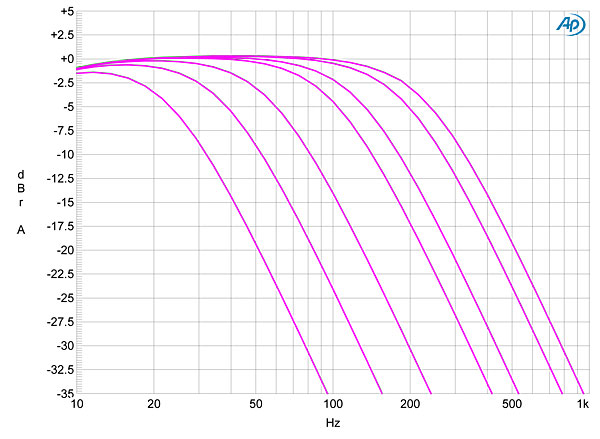
The top and bottom blue and red traces in fig.2 show the effect of the tone controls set to their maximum and minimum positions. Note that the level drops by an audible 0.43dB when the tone-control button is pressed but the controls are set to their detented, zero-action positions. The blue traces in fig.2 show the response at the main outputs when the subwoofer switch is activated. The high-pass filter can be set to frequencies between 20Hz (left trace) and 140Hz (right trace), or can be switched off altogether if the user wants to use the main speakers full-range, which provides the maximum flexibility in marrying those speakers to a subwoofer. The P 5's subwoofer output can be set to have low-pass frequencies ranging from the same 20Hz to 140Hz, as well as none. These are shown in fig.3; the filter slopes appear to be second-order.
Fig.2 Parasound Halo P 5, responses of: tone control set to maximum and minimum (red traces); high-pass–filtered output set (from left to right), 20–140Hz (5dB/vertical div.).
Fig.3 Parasound Halo P 5, subwoofer output response with low-pass–filtered output set (from left to right), 20–140Hz (5dB/vertical div.).
Channel separation via the line inputs was excellent, at 110dB below 1kHz, and still 88dB R–L and 91dB L–R at 20kHz (not shown). The line-input signal/noise ratio was also respectable. Taken with the input shorted but the volume control set to its maximum—very much the worst case for a preamplifier—the wideband, unweighted ratio was 80dB ref. 1V output. This improved to 101dB when the measurement bandwidth was restricted to the audioband, and to 104dB when A-weighted. Even with this low level of audioband noise, the P 5's distortion was even lower.
Fig.4 plots the percentage of THD+noise against output level. The downward slope of the trace below 7V indicates that the measurement percentage is actually noise—a constant level of background noise becomes an increasing percentage as the signal level drops. The distortion starts to sharply rise at 7V, which Parasound specifies as the maximum output level, but the P 5 doesn't reach 1% THD (our standard definition of clipping) until 8V. Both voltages are well above what will be required of the P 5 in practice. The behavior was identical into the punishing 600 ohm load, so I haven't shown it, but this suggests that the Parasound preamp is bombproof.
Fig.4 Parasound Halo P 5, unbalanced distortion (%) vs 1kHz output voltage into 100k ohms.
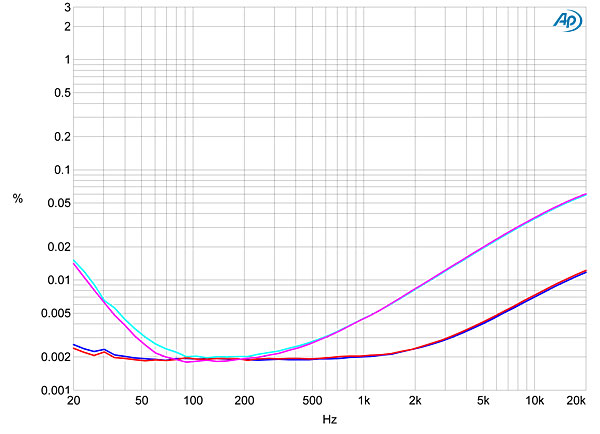
I plotted how the percentage of THD+N varied with frequency (fig.5) at a high 5V output, which is where I could be sure that I would be measuring actual distortion rather than noise. Even so, the THD+N measurement into 100k ohms (blue and red traces) is still noise below 1500Hz. However, the distortion does start to rise slightly above that frequency, reaching 0.01% just below 20kHz. Into 600 ohms (cyan, magenta), the distortion rises more at high frequencies and also does so at low frequencies, suggesting that the P 5 is working hard into this demanding load. Even so, the percentage never reaches an audibly significant level. Though there are minute traces of second- and third-harmonic distortion visible in the spectrum of a 50Hz tone at 2V (fig.6), the primary spectral components lie at 180Hz and other harmonics of the AC line frequency. Though there is a trace of 120Hz noise present (this is the full-wave–rectified supply frequency), this lies at –115dB, suggesting good internal grounding of the circuit. Intermodulation distortion (fig.7) is also vanishingly low.
Fig.5 Parasound Halo P 5, unbalanced THD+N (%) vs frequency at 5V into: 100k ohms (left channel blue, right red), 600 ohms (left cyan, right magenta).
Fig.6 Parasound Halo P 5, unbalanced spectrum of 50Hz sinewave, DC–1kHz, at 2V into 100k ohms (left channel blue, right red; linear frequency scale).
Fig.7 Parasound Halo P 5, balanced HF intermodulation spectrum, DC–30kHz, 19+20kHz at 2V peak into 100k ohms (left channel blue, right red; linear frequency scale).
Turning to the phono-input performance, a rear-panel switch selects among: moving-magnet with an input impedance of 47k ohms; moving-coil, also with an input impedance of 47k ohms; and moving-coil with an input impedance of 100 ohms. All three settings preserved absolute polarity, and at 1kHz I measured respective input impedances of 45k ohms, 45k ohms, and 100 ohms for the three settings. The first two impedances were the same at low frequencies, but dropped slightly at 20kHz, to 38k ohms. This will not be a problem. Measured at the main outputs, the MM and MC settings had maximum respective gains of 44.9 and 64.5dB. I performed all subsequent measurements from the Rec Out jacks, which are taken from before the volume control. The respective gains were now 34.4 and 53.9dB, both a little lower than is typical, though this is not a problem but a benefit—it maximizes both S/N ratios and overload margins.
The unweighted S/N for the MM input, taken with the input shorted and ref. 1kHz at 5mV, was a good 68dB. This improved to 78.6dB when A-weighted. The MC input's ratios were about 18dB lower, which corresponds to the greater gain available. Channel separation was good, at 70dB at 1kHz. The phono stage's RIAA error is shown in fig.8. There is superb matching between the channels, and very little error in the midrange and bass. However, the rising error above 10kHz indicates that Parasound has implemented the so-called "Neumann Fourth Pole" in the equalization network, something I am not in favor of. (The debate continues.)
Fig.8 Parasound Halo P 5, MM phono input, response with RIAA correction (left channel blue, right red) (1dB/vertical div.).
As implied above, overload margins are very high, at 25dB at all frequencies for both MM and MC settings. Even with 1kHz fed at 10mV to the MM input, the distortion was vanishingly low, with just a trace of second harmonic visible above the noise floor in fig.9. The same was true for intermodulation distortion (fig.10).
Fig.9 Parasound Halo P 5, MM phono input, spectrum of 1kHz sinewave, DC–10kHz, at 10mV input (linear frequency scale).
Fig.10 Parasound Halo P 5, MM phono input, HF intermodulation spectrum, DC–30kHz, 19+20kHz at 100mV peak input (linear frequency scale; left channel blue, right red).
I tested the P 5's digital inputs using a TosLink connection from the Audio Precision SYS2722 and USB from my MacBook Pro laptop running on battery power. The TosLink input achieved lock at all sample rates up to 192kHz; USB was restricted to 96kHz and below. Apple's USB Prober utility identified the P 5 as "P5" from "Parasound" and indicated that it will work in the conventional isochronous adaptive mode at all sample rates up to 96kHz—but, significantly, not at 88.2kHz. A full-scale tone results in a maximum level of 1.97V from the Rec Out jacks, 6.73V from the main output jacks, the latter suggesting that the D/A section's gain architecture is well arranged, given that output-stage clipping begins at 7V (see above). All subsequent measurements were taken at the Rec Out jacks.
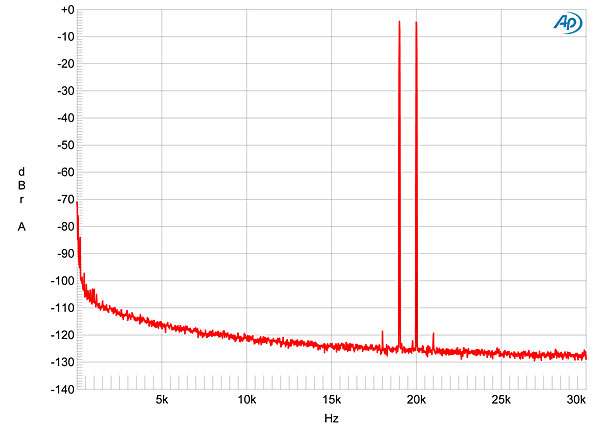
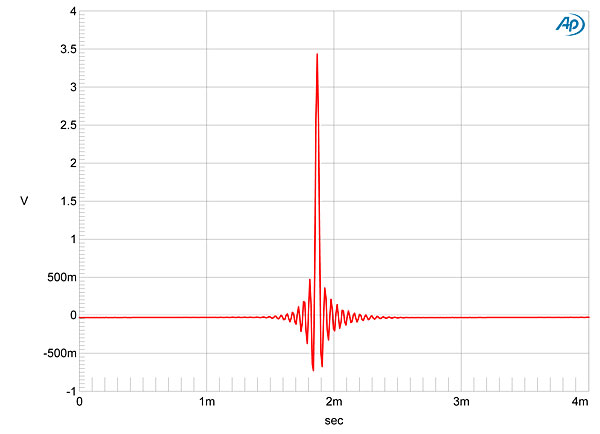
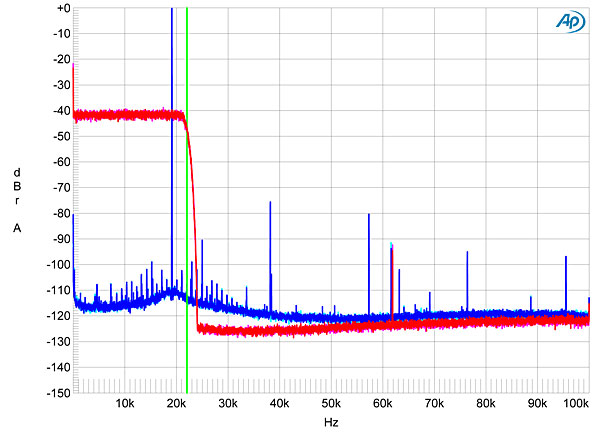
The P 5 DAC preserved absolute polarity. Its impulse response, shown in fig.11, indicates that the reconstruction filter is a conventional linear-phase, finite-impulse-response type. As shown by the red trace in fig.12, this filter rolls off sharply above the audioband, suppressing the ultrasonic image of a full-scale 19.1kHz tone by 90dB (blue trace). However, the noise floor rises around the base of the 19.1kHz tone, with low-level spectral sidebands in evidence. There is also a spectral spike of unknown origin apparent around 62kHz, and the second, third, fourth, and fifth harmonics of the 19.1kHz tone can be seen, though these all lie at or below –76dB (0.015%).
Fig.11 Parasound Halo P 5, digital input, impulse response (4ms time window).
Fig.12 Parasound Halo P 5, digital input, wideband spectrum of white noise at –4dBFS (left channel blue, right magenta) and 19.1kHz tone at 0dBFS (left cyan, right red), with data sampled at 44.1kHz (20dB/vertical div.). The green line represents 22.05kHz.
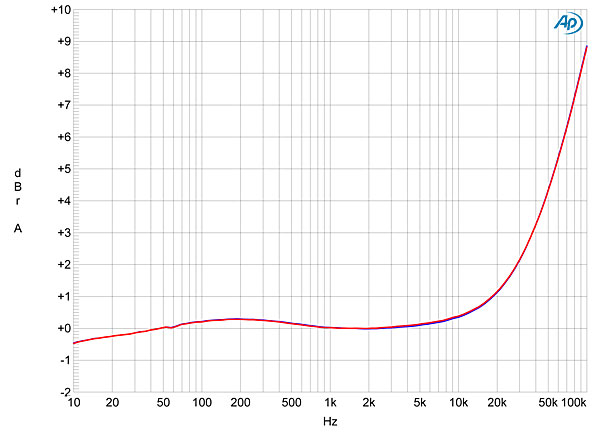
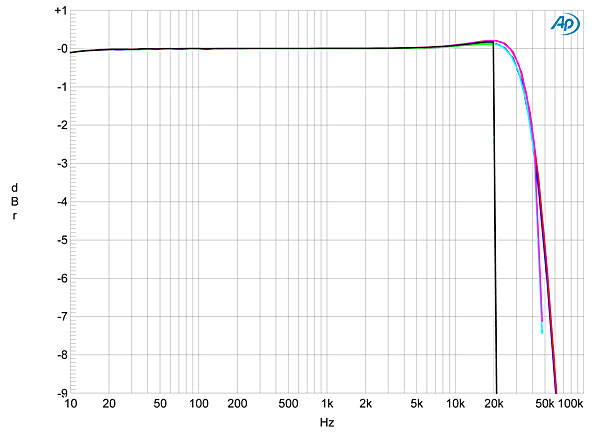
Fig.13 shows the P 5's digital-input frequency response at sampling rates of 44.1kHz (green and gray traces), 96kHz (cyan, magenta), and 192kHz (blue, red). There is a sharp rolloff above 20kHz with 44.1kHz data, but the higher sample rates continue the small rise at the top of the audioband before rolling off. Though it is difficult to see at the scale these graphs are printed in the magazine, there is very slightly more ultrasonic extension with 192kHz data than with 96kHz data. Channel separation for the D/A section (not shown) was good, at 97dB in both directions at 1kHz.
Fig.13 Parasound Halo P 5, digital input, frequency response at –12dBFS with data sampled at: 44.1kHz (left channel green, right gray), 96kHz (left cyan, right magenta), 192kHz (left blue, right red) (1dB/vertical div.).
Fig.14 Parasound Halo P 5, digital input, spectrum with noise and spuriae of dithered 1kHz tone at –90dBFS with: 16-bit data (left channel cyan, right magenta), 24-bit data (left blue, right red) (20dB/vertical div.).
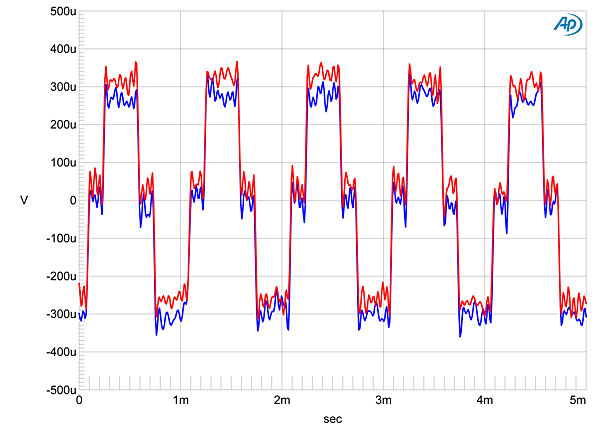
Fig.15 Parasound Halo P 5, digital input, waveform of undithered 1kHz sinewave at –90.31dBFS, 16-bit data (left channel blue, right red).
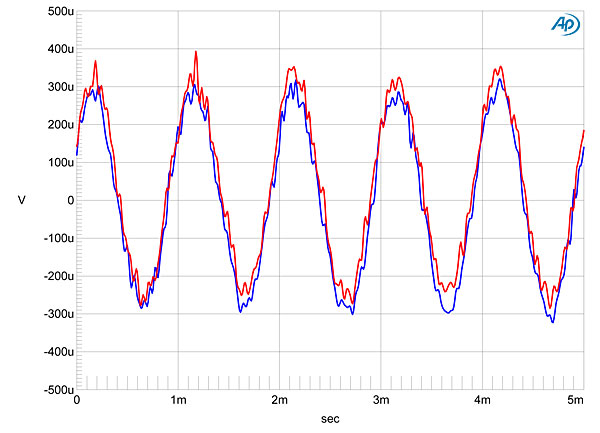
Fig.16 Parasound Halo P 5, digital input, waveform of undithered 1kHz sinewave at –90.31dBFS, 24-bit data (left channel blue, right red).
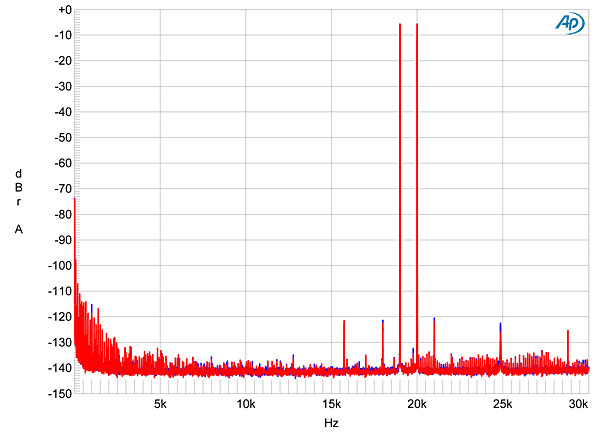
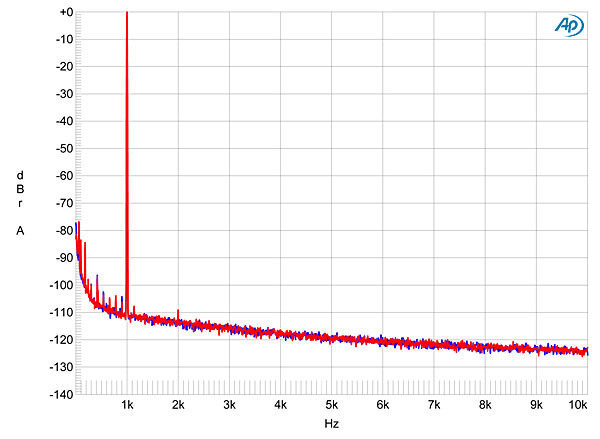
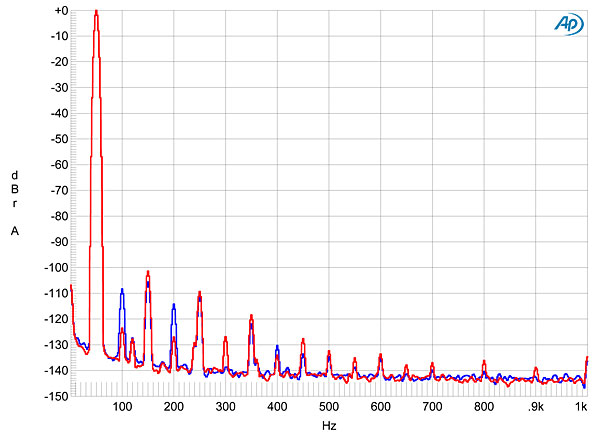
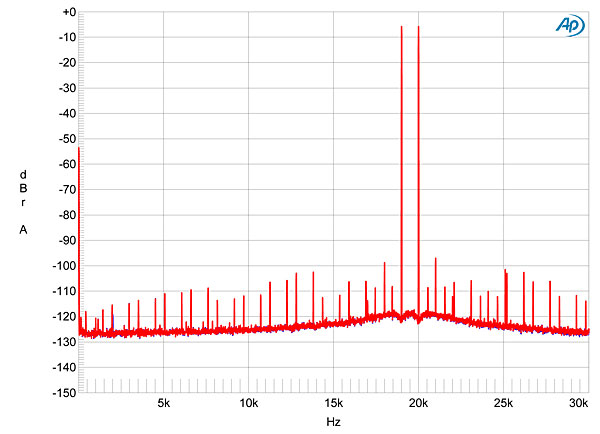
The third harmonic was the highest in level with full-scale tones (fig.17), but at –100dB, this won't be a problem. However, when tested for intermodulation distortion with 24-bit data representing an equal mix of 19 and 20kHz tones and the summed waveform reaching 0dBFS, while fig.18 shows very little intermodulation, there is, as in fig.12, a rise in the noise floor around the tones and the presence of spurious if low-level tones.
Fig.17 Parasound Halo P 5, digital input, spectrum of 50Hz sinewave, DC–1kHz, at 0dBFS (left channel blue, right red; linear frequency scale).
Fig.18 Parasound Halo P 5, digital input, HF intermodulation spectrum, DC–30kHz, 19+20kHz at 0dBFS (left channel blue, right red; linear frequency scale).
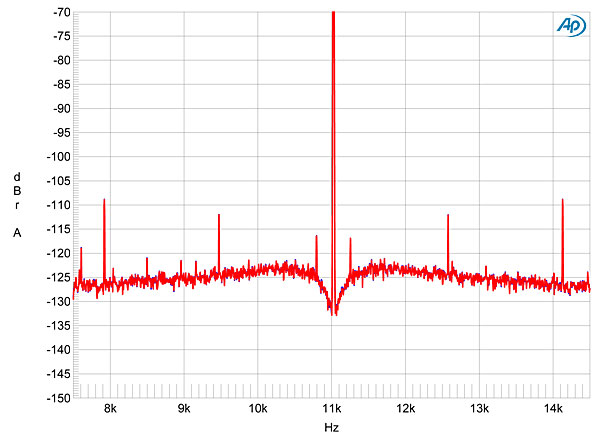
This rather anomalous behavior continued when I tested the P 5's rejection of word-clock jitter on its TosLink S/PDIF input with a 16-bit version of the Miller-Dunn J-Test signal (fig.19). The rise in the noise floor has completely obscured almost all the odd-order harmonics of the low-frequency, LSB-level squarewave and three pairs of sidebands can be seen, at ±2290, ±1552, and ±3100Hz. The first pair is obviously data-related, but the other two are of unknown origin. These three sideband pairs were present with 24-bit J-Test S/PDIF data, and also with 16- and 24-bit J-Test data sourced via USB. There was also no lowering of the noise floor with 24-bit data, as there had been with lower-frequency data in fig.14. It appears, therefore, that while the P 5's digital section has high resolution in the midrange, it doesn't in the top octave, where the level of the noise floor is signal dependent.
Fig.19 Parasound Halo P 5, digital input, high-resolution jitter spectrum of analog output signal, 11.025kHz at –6dBFS, sampled at 44.1kHz with LSB toggled at 229Hz: 16-bit data via S/PDIF from AP SYS2722 (left channel blue, right red). Center frequency of trace, 11.025kHz; frequency range, ±3.5kHz.