Sidebar 3: Measurements
I measured the Octave Audio RE 290 using Stereophile's loan sample of the top-of-the-line Audio Precision SYS2722 system (see the January 2008 "As We See It" and www.ap.com). As Erick Lichte reviewed the RE 290 with KT120 tubes and the Super Black Box capacitor bank, that's how I measured it, with its rear-panel switch set to High Power, as recommended for these tubes. After warming up the amplifier for an hour, I checked the bias for each of the four output tubes using the central LED array and the right-hand rotary switch on the front panel. All the tubes were correctly biased.
The voltage gain at 1kHz into 8 ohms measured 30.8dB for an unbalanced input (nearly 3dB higher than specified), but 6dB lower for the balanced input. Both inputs preserved absolute polarity (ie, were non-inverting), the XLRs being wired with pin 2 hot. The balanced input impedance was 10k ohms per signal phase, as specified; the unbalanced input impedance was much higher, at >150k ohms at low and middle frequencies, dropping slightly to 71k ohms at 20kHz.
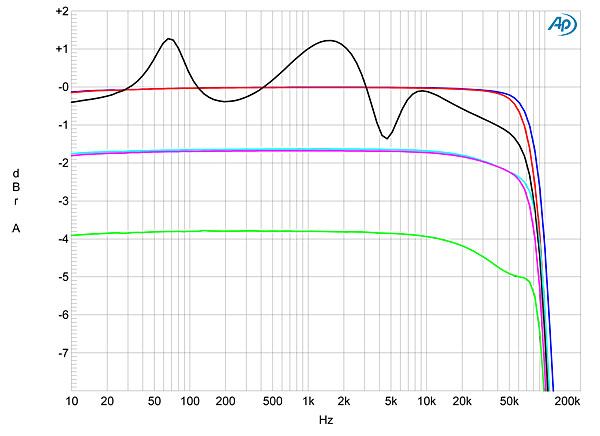
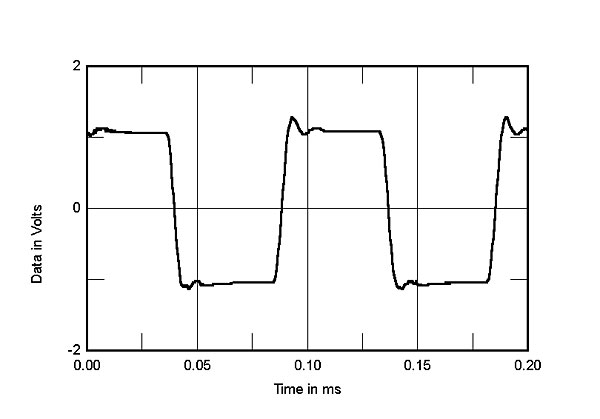
The output impedance was fairly high, measuring 2.2 ohms at 20Hz and 1kHz, rising slightly to 2.4 ohms at 20kHz. As a result, the variation in the amplifier's frequency response with our standard simulated loudspeaker was ±1.2dB (fig.1, gray trace). The other traces in this graph show the response into 8, 4, and 2 ohms. Note the excellent matching between channels and the wide bandwidth, the upper-frequency rolloff into 8 ohms (blue and red traces) being –3dB at 90kHz. The increasing output impedance at the top of the audio octave reduces the bandwidth a little as the load impedance drops, and into 2 ohms there is the beginning of a small peak visible at 70kHz. With a 10kHz squarewave into 8 ohms (fig.2), a small degree of overshoot is visible on the waveform's leading edges, followed by a single cycle of damped ringing.
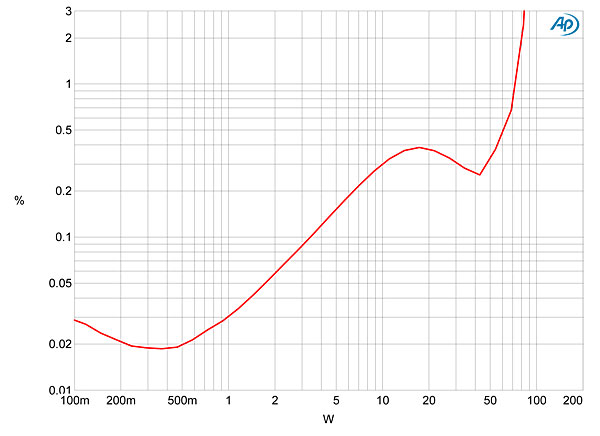
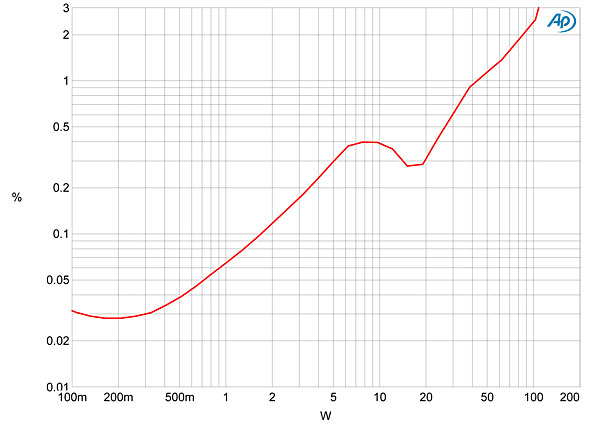
 Figs. 4, 5, and 6 show how the THD+noise percentage in the RE 290's output varies with power into 8, 4, and 2 ohms, respectively. Octave specifies the maximum power into 4 ohms with KT120s as 100Wpc (17dBW), and fig.5 reveals that, with both channels operating, the amplifier reaches this power at just below 3% distortion. At our usual definition of clipping of 1% THD, the amplifier gives 48W into 4 ohms (13.8dBW) and 75Wpc into 8 ohms (18.75dBW). Though the THD+N is very low below 1W into either load, the steady rise in THD with power in these graphs suggests that only a modest degree of loop negative feedback is used.

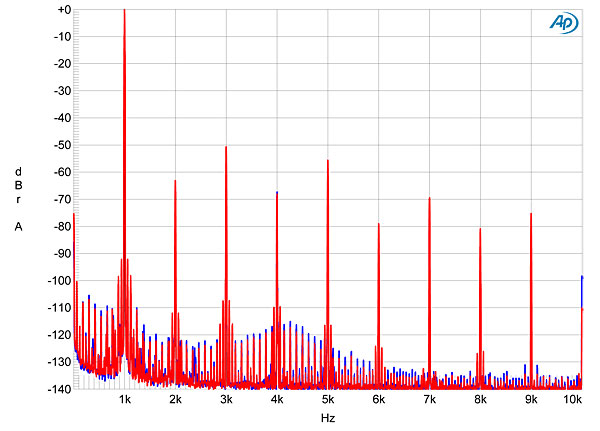
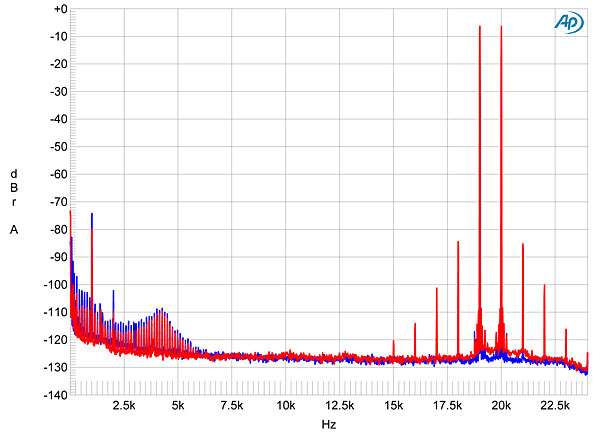
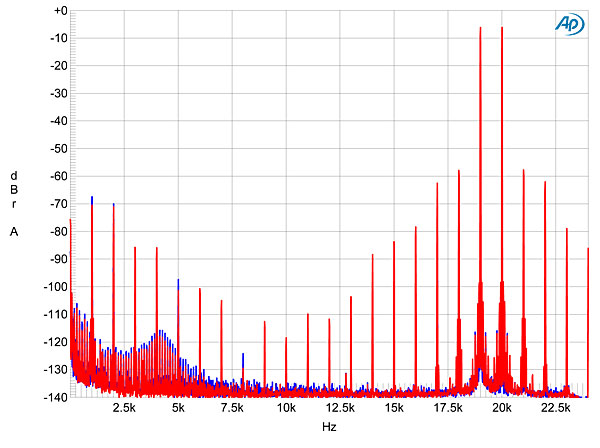
 Fortunately, the nature of the distortion is heavily third-harmonic (fig.8), which will be subjectively innocuous. At low powers into 8 ohms, the second harmonic is almost as high as the third (fig.9), both lying at –74dB (0.02%) in the left channel (blue trace). At higher powers (fig.10), the odd harmonics are dominant, though the AC-supply–related spuriae don't increase in level. The picture was similar for intermodulation distortion (figs. 11 and 12). At low powers, the RE 290 produces a low level of intermodulation products when driving an equal mix of 19 and 20kHz tones (fig.10), with the 1kHz difference product lying at –74dB (0.02%) in the left channel (blue) and –80dB (0.01%) in the right (red). At higher powers, however, a picket fence of higher-order products can be seen (fig.12).


 Overall, I was impressed by the Octave Audio RE 290's measured performance. It obviously uses high-quality output transformers, and while the low negative feedback reduces linearity at high powers and into lower impedances, the amplifier is very linear at low powers.—John Atkinson
Fig.1 Octave Audio RE 290, frequency response at 2.83V into: simulated loudspeaker load (gray), 8 ohms (left channel blue, right red), 4 ohms (left cyan, right magenta), 2 ohms (green) (1dB/vertical div.).
Fig.2 Octave Audio RE 290, small-signal 10kHz squarewave into 8 ohms.
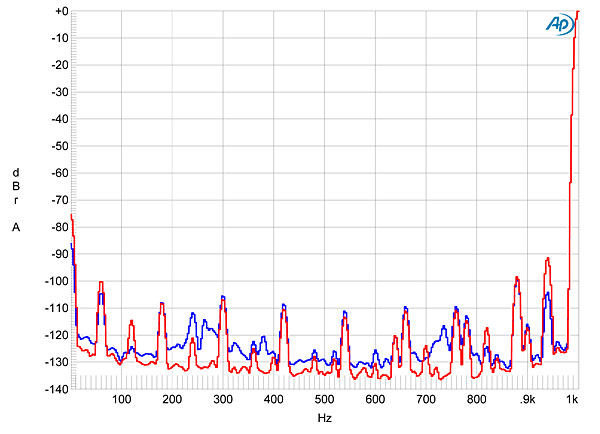
Channel separation (not shown) was even with frequency, at 75dB in both directions below 2kHz. The unweighted, wideband signal/noise ratio, ref. 1W into 8 ohms with the input shorted, was good rather than great, at 75.4dB left and 78.2dB right. Restricting the measurement bandwidth to the audioband improved these ratios to 81.5 and 88.5dB, respectively, while switching in an A-weighting filter gave S/N ratios of 90.7 and 93.2dB. Fig.3 shows the low-frequency spectrum of the RE 290's output while it drove a 1kHz sinewave into 8 ohms. AC-supply–related spuriae can be seen in both channels, with 60Hz and its odd harmonics predominant. This suggests that there is magnetic interference from the AC power transformer, though all the spuriae lie at a low level in absolute terms.
Fig.3 Octave Audio RE 290, spectrum of 1kHz sinewave, DC–1kHz, at 30W into 8 ohms (left channel blue, right red; linear frequency scale).
Fig.4 Octave Audio RE 290, distortion (%) vs 1kHz continuous output power into 8 ohms (left channel blue).
Fig.5 Octave Audio RE 290, distortion (%) vs 1kHz continuous output power into 4 ohms (left channel blue).
Fig.6 Octave Audio RE 290, distortion (%) vs 1kHz continuous output power into 2 ohms (left channel blue).
Fig.7 shows how the THD+N percentage varies with frequency, at 2.83V into 8 ohms (blue and red traces), 4 ohms (cyan and magenta), and 2 ohms (gray). The rise in THD at low frequencies is modest, implying that the RE 290's output transformer has a hefty core. The rise in THD at the other end of the spectrum is also modest for a push-pull amplifier with a single pair of output tubes, but the RE 290 is clearly most comfortable driving higher impedances. Octave specifies that the lowest impedance that should be used with the RE 290 is 2 ohms, but fig.7 suggests that the amplifier's owner not use speakers whose impedance drops below 4 ohms.
Fig.7 Octave Audio RE 290, THD+N (%) vs frequency at 2.83V into: 8 ohms (left channel blue, right red), 4 ohms (left cyan, right magenta), 2 ohms (left gray).
Fig.8 Octave Audio RE 290, 1kHz waveform at 2W into 4 ohms (top), 0.265% THD+N; distortion and noise waveform with fundamental notched out (bottom, not to scale).
Fig.9 Octave Audio RE 290, spectrum of 1kHz sinewave, DC–1kHz, at 1W into 8 ohms (left channel blue, right red; linear frequency scale).
Fig.10 Octave Audio RE 290, spectrum of 1kHz sinewave, DC–1kHz, at 30W into 8 ohms (left channel blue, right red; linear frequency scale).
Fig.11 Octave Audio RE 290, HF intermodulation spectrum, DC–24kHz, 19+20kHz at 1W peak into 8 ohms (left channel blue, right red; linear frequency scale).
Fig.12 Octave Audio RE 290, HF intermodulation spectrum, DC–24kHz, 19+20kHz at 30W peak into 8 ohms (left channel blue, right red; linear frequency scale).


