Then there is the fact that the first method drives the speaker-under-test with a wide-band noise signal while the second drives it with one frequency at a time. Some engineers conjecture that speakers will behave differently to the two stimuli. Having used both methods, I have only found minor differences between the results, if at all. However, for practical reasons, I use the second method, using an Audio Precision System One to drive the loudspeaker in 240 frequency steps from 10Hz to 50kHz with 6V via a series 600 ohm resistor (actually the unit's source impedance). While a true plot of a loudspeaker's complex impedance would be a three-dimensional "pigtail" plotted against magnitude, phase, and frequency, I plot a conventional Bode plot of magnitude and phase against frequency (fig.2), two of the two-dimensional "shadows" cast by the three-dimensional pigtail plot. I find this more informative than a plot of the complex impedance (the end view of the pigtail). I also use! a linear impedance scale rather than the logarithmic scale preferred by some engineers, which I also find more informative. To ensure consistency and accuracy, I regularly measure the impedance of a reference 0.5% tolerance 10-ohm resistor. 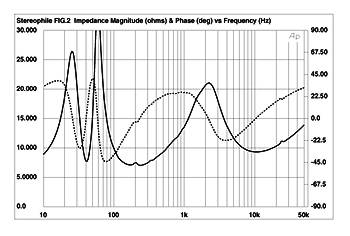 Fig.2 Typical two-way loudspeaker, measured electrical impedance magnitude (solid trace) and phase (dashed trace) plotted against frequency in Hz. In private communications back in 1991, both Fred Davis and Don Keele pointed out that Stereophile's loudspeaker impedance phase curves published between late 1990 and early 1991 were upside down, in that the positive and negative phase angles were reversed [22]. (Negative phase angle, the current leading the voltage, is due to the load being capacitive; positive phase angle, with the current lagging the voltage, is due to the load being inductive.) This appeared to be due to a software bug; Stereophile's published curves since then have been corrected, with negative phase angles plotted below the frequency axis. However, looking at impedance plots published in books and other magazines reveals wide disagreement on this. Some writers still appear to confuse capacitive and inductive phase angle, while others conventionally plot negative phase angle above the frequency axis.
What is a typical loudspeaker impedance? Fig.3 tabulates the mean impedance magnitudes of 330 of the loudspeakers measured from January 1991 through June 1997 (six speakers had integral amplifiers or were intended to be used with external line-level crossovers; the impedance of the others were not measured for various reasons). Only a small number of models feature mean impedances below 4 ohms or above 15 ohms, with the overall mean equal to 8.6 ohms. The median value is 9.25 ohms. According to Martin Colloms [18], the German DIN standard requires that a loudspeaker's impedance magnitude not vary more than ±20% from its nominal value. However, I have found loudspeaker impedances tend to range higher than this, the average standard deviation on the mean 8.6 ohms being 3.7 ohms or 43%. As long as the driving amplifier has a low source impedance, this variation in impedance magnitude will not introduce any sonic effects. But when a tube amplifier is used, which can have a so! urce impedance of perhaps a few ohms, the result can be a significant variation of the loudspeaker's perceived frequency balance, as has been pointed out in Stereophile [23].
Fig.2 Typical two-way loudspeaker, measured electrical impedance magnitude (solid trace) and phase (dashed trace) plotted against frequency in Hz. In private communications back in 1991, both Fred Davis and Don Keele pointed out that Stereophile's loudspeaker impedance phase curves published between late 1990 and early 1991 were upside down, in that the positive and negative phase angles were reversed [22]. (Negative phase angle, the current leading the voltage, is due to the load being capacitive; positive phase angle, with the current lagging the voltage, is due to the load being inductive.) This appeared to be due to a software bug; Stereophile's published curves since then have been corrected, with negative phase angles plotted below the frequency axis. However, looking at impedance plots published in books and other magazines reveals wide disagreement on this. Some writers still appear to confuse capacitive and inductive phase angle, while others conventionally plot negative phase angle above the frequency axis.
What is a typical loudspeaker impedance? Fig.3 tabulates the mean impedance magnitudes of 330 of the loudspeakers measured from January 1991 through June 1997 (six speakers had integral amplifiers or were intended to be used with external line-level crossovers; the impedance of the others were not measured for various reasons). Only a small number of models feature mean impedances below 4 ohms or above 15 ohms, with the overall mean equal to 8.6 ohms. The median value is 9.25 ohms. According to Martin Colloms [18], the German DIN standard requires that a loudspeaker's impedance magnitude not vary more than ±20% from its nominal value. However, I have found loudspeaker impedances tend to range higher than this, the average standard deviation on the mean 8.6 ohms being 3.7 ohms or 43%. As long as the driving amplifier has a low source impedance, this variation in impedance magnitude will not introduce any sonic effects. But when a tube amplifier is used, which can have a so! urce impedance of perhaps a few ohms, the result can be a significant variation of the loudspeaker's perceived frequency balance, as has been pointed out in Stereophile [23]. 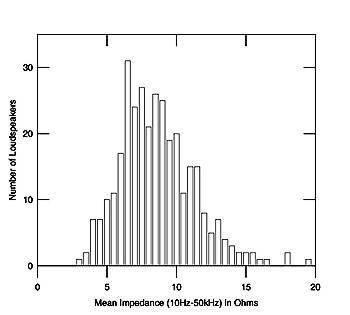 Fig.3 330 loudspeakers, mean impedance magnitudes. Fig.4 tabulates the minimum impedance magnitudes of the same 330 loudspeakers. It can be seen that there is much less variation than with the mean values, with the majority of models having a lowest impedance between 2.76 and 4.26 ohms. The mean and median were 4.3 ohms. In fact, disregarding an exotic electrostatic design that resembled a short circuit above 30kHz, and early samples of two speakers that featured an exotic crossover and dropped below 0.5 ohms above 100kHz, only 6 models had a lowest measured magnitude below 2 ohms. For interest's sake, the loudspeaker with the highest minimum value—8.33 ohms at 171Hz, with a phase angle of -3.1 degrees—was a 1977-vintage BBC LS3/5A. One interesting national difference emerged: moving-coil speakers designed by British engineers tended to have their minimum impedance in the high treble, around 10kHz, while those from US engineers tended to have it in the low midrange.
 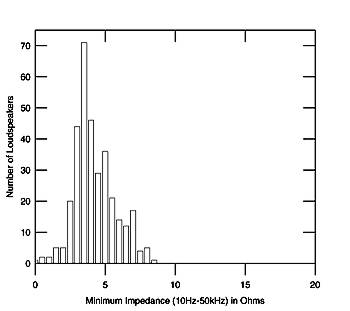 Fig.4 330 loudspeakers, minimum impedance magnitudes.
Fig.2 Typical two-way loudspeaker, measured electrical impedance magnitude (solid trace) and phase (dashed trace) plotted against frequency in Hz. In private communications back in 1991, both Fred Davis and Don Keele pointed out that Stereophile's loudspeaker impedance phase curves published between late 1990 and early 1991 were upside down, in that the positive and negative phase angles were reversed [22]. (Negative phase angle, the current leading the voltage, is due to the load being capacitive; positive phase angle, with the current lagging the voltage, is due to the load being inductive.) This appeared to be due to a software bug; Stereophile's published curves since then have been corrected, with negative phase angles plotted below the frequency axis. However, looking at impedance plots published in books and other magazines reveals wide disagreement on this. Some writers still appear to confuse capacitive and inductive phase angle, while others conventionally plot negative phase angle above the frequency axis. Fig.3 330 loudspeakers, mean impedance magnitudes. Fig.4 tabulates the minimum impedance magnitudes of the same 330 loudspeakers. It can be seen that there is much less variation than with the mean values, with the majority of models having a lowest impedance between 2.76 and 4.26 ohms. The mean and median were 4.3 ohms. In fact, disregarding an exotic electrostatic design that resembled a short circuit above 30kHz, and early samples of two speakers that featured an exotic crossover and dropped below 0.5 ohms above 100kHz, only 6 models had a lowest measured magnitude below 2 ohms. For interest's sake, the loudspeaker with the highest minimum value—8.33 ohms at 171Hz, with a phase angle of -3.1 degrees—was a 1977-vintage BBC LS3/5A. One interesting national difference emerged: moving-coil speakers designed by British engineers tended to have their minimum impedance in the high treble, around 10kHz, while those from US engineers tended to have it in the low midrange. Fig.4 330 loudspeakers, minimum impedance magnitudes. 


