Sidebar 3: Measurements With its single amplification stage, the Conrad-Johnson Premier 18LS inverts absolute signal polarity. The input impedance at 1kHz was a usefully high 101k ohms and the maximum voltage gain was 21.9dB. The volume-control steps ranged from 1.3dB at the very top of the range to 0.25 and 0.55dB nearer the center of the range. The maximum indicated volume was "99," but between "99" and "89" only alternate numbers resulted in a reduction of level; ie, "98" and "97" were both equivalent to an attenuation of 1.35dB, "96" and "95" were both equivalent to a further attenuation of 1.3dB, and so on. The output impedance was quite low across most of the audioband, at 72 ohms at 20kHz, and a little higher, 183 ohms, at 1kHz. The source impedance rose to a high 1.5k ohms at 20Hz, however, which will result in prematurely rolled-off low frequencies with a power amp having an input impedance much below 20k ohms. This can be seen in fig.1, where the bottom pair of traces on the left (-3dB at 50Hz) was taken with the Premier 18LS driving the very low load of 600 ohms. Into 100k ohms, however, the bass is flat down to the 10Hz limit of this graph.  Fig.1 Conrad-Johnson Premier 18LS, frequency response into 100k ohms with volume control at unity gain (middle pair of traces at 20kHz, top traces at 100Hz), with volume control at maximum (bottom traces at 20kHz), and into 600 ohms with volume control at unity gain (top traces at 20kHz, bottom traces at 100Hz). (0.5dB/vertical div.)
At the other end of the spectrum, the 600 ohm load results in a slight rise in the top octave, this due to the lower source impedance in this region. More significant, there appeared to be some correlation between ultrasonic bandwidth and the volume-control setting. With the control set to unity gain ("63"), the response extends out to -1dB at 150kHz. But with the volume control set to its maximum position ("99"), the -1dB point drops to 12kHz. This would be audible, but situations necessitating the use of the Premier 18's full 21.9dB of gain are, fortunately, extremely unlikely. Channel separation (fig.2) was good below 1kHz, with any crosstalk buried beneath the noise floor. However, capacitive coupling resulted in a reduction in separation to 60dB at the top of the audioband. The unweighted, wideband signal/noise ratio (ref. 1V output) was disappointing, at 73.4dB. This improved by 10dB when the measurement bandwidth was reduced to 22Hz-22kHz, and by a further 5dB when an A-weighting filter was used.
Fig.1 Conrad-Johnson Premier 18LS, frequency response into 100k ohms with volume control at unity gain (middle pair of traces at 20kHz, top traces at 100Hz), with volume control at maximum (bottom traces at 20kHz), and into 600 ohms with volume control at unity gain (top traces at 20kHz, bottom traces at 100Hz). (0.5dB/vertical div.)
At the other end of the spectrum, the 600 ohm load results in a slight rise in the top octave, this due to the lower source impedance in this region. More significant, there appeared to be some correlation between ultrasonic bandwidth and the volume-control setting. With the control set to unity gain ("63"), the response extends out to -1dB at 150kHz. But with the volume control set to its maximum position ("99"), the -1dB point drops to 12kHz. This would be audible, but situations necessitating the use of the Premier 18's full 21.9dB of gain are, fortunately, extremely unlikely. Channel separation (fig.2) was good below 1kHz, with any crosstalk buried beneath the noise floor. However, capacitive coupling resulted in a reduction in separation to 60dB at the top of the audioband. The unweighted, wideband signal/noise ratio (ref. 1V output) was disappointing, at 73.4dB. This improved by 10dB when the measurement bandwidth was reduced to 22Hz-22kHz, and by a further 5dB when an A-weighting filter was used. 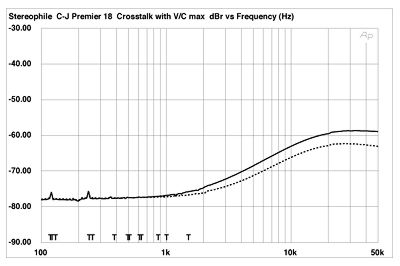 Fig.2 Conrad-Johnson Premier 18LS, channel separation with volume control at maximum (R-L dashed, 10dB/vertical div.).
Fig.3 shows how the percentage of distortion and noise in the Conrad-Johnson's output varies with signal voltage (at 1kHz). At clipping (1% THD+noise), the preamp can deliver more than 10V into loads of 10k ohms and above, which is way more than any real-life situation will require. Even into 1k ohm, there are still 7V available at clipping. The upward slope of the traces below 1.2V output means that the distortion is actually buried in the noise below this level.
Fig.2 Conrad-Johnson Premier 18LS, channel separation with volume control at maximum (R-L dashed, 10dB/vertical div.).
Fig.3 shows how the percentage of distortion and noise in the Conrad-Johnson's output varies with signal voltage (at 1kHz). At clipping (1% THD+noise), the preamp can deliver more than 10V into loads of 10k ohms and above, which is way more than any real-life situation will require. Even into 1k ohm, there are still 7V available at clipping. The upward slope of the traces below 1.2V output means that the distortion is actually buried in the noise below this level. 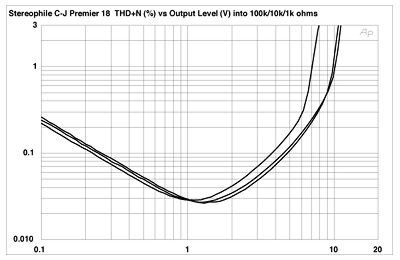 Fig.3 Conrad-Johnson Premier 18LS, distortion (%) vs output voltage into (from right to left at 3%): 100k, 10k, and 1k ohm. The minima between 1V and 2V in the fig.3 traces suggested that I should plot the THD+noise against frequency in this region. Accordingly, fig.4 shows the traces taken into three loads: 100k, 10k, and 1k ohm. The distortion rises slightly at low frequencies into the low load, but otherwise the load impedance has very little effect on the preamp's behavior. However, while the midrange THD is very low, at less than 0.02%, it does rise in the top three octaves, reaching 0.2% just below 20kHz.
 Fig.4 Conrad-Johnson Premier 18LS, THD+noise (%) vs frequency at 1.5V into 100k and 10k ohms (bottom traces), and into 1k ohm (top below 1kHz). (Right channel dashed.) At low frequencies and high levels into 100k ohms, the highest harmonics are the third and fifth (fig.5), with the 120Hz AC supply component visible at -84dB (0.006%). Dropping the load to 1k ohm (fig.6) brings the third harmonic up to -72dB (0.025%), and the second harmonic can now be seen at -80dB (0.01%). At higher frequencies and lower levels, the distortion drops to a very low level (0.0035%, not including the noise contribution). Though the third harmonic is still the highest in level in fig.7, at -90dB it is not going to bother anyone.
  Fig.5 Conrad-Johnson Premier 18LS, spectrum of 50Hz sinewave, DC-1kHz, at 2V into 100k ohms (linear frequency scale, 10dB/vertical div.).
 Fig.6 Conrad-Johnson Premier 18LS, spectrum of 1kHz sinewave, DC-1kHz, at 2V into 1k ohm (linear frequency scale, 10dB/vertical div.).
  Fig.7 Conrad-Johnson Premier 18LS, spectrum of 1kHz sinewave, DC-10kHz, at 1V into 8k ohms (linear frequency scale, 10dB/vertical div.). Despite the rise in THD at high frequencies seen in fig.4, the Premier 18LS produced very low levels of intermodulation distortion with the demanding mixture of 19kHz and 20kHz tones (fig.8). However, the noise floor in figs. 7 and 8 is around 12dB higher than with the tubed Nagra and VTL preamps reviewed in the November issue, despite Conrad-Johnson's use of solid-state devices. The designer's decision not to use overall loop negative feedback results in the 18LS having too much gain for practical use and therefore having a higher noise floor than would otherwise be the case. However, as it is widely felt that the lack of loop negative feedback results in better sound, perhaps due to the feedback shifting the distortion energy to higher-order and therefore more subjectively objectionable components, Bill Conrad and Lew Johnson may well have made the correct choice, to judge from Larry Greenhill's auditioning comments.—John Atkinson
 Fig.8 Conrad-Johnson Premier 18LS, HF intermodulation spectrum, DC-24kHz, 19+20kHz at 1V into 8k ohms (linear frequency scale).
Fig.1 Conrad-Johnson Premier 18LS, frequency response into 100k ohms with volume control at unity gain (middle pair of traces at 20kHz, top traces at 100Hz), with volume control at maximum (bottom traces at 20kHz), and into 600 ohms with volume control at unity gain (top traces at 20kHz, bottom traces at 100Hz). (0.5dB/vertical div.) Fig.2 Conrad-Johnson Premier 18LS, channel separation with volume control at maximum (R-L dashed, 10dB/vertical div.). Fig.3 Conrad-Johnson Premier 18LS, distortion (%) vs output voltage into (from right to left at 3%): 100k, 10k, and 1k ohm. The minima between 1V and 2V in the fig.3 traces suggested that I should plot the THD+noise against frequency in this region. Accordingly, fig.4 shows the traces taken into three loads: 100k, 10k, and 1k ohm. The distortion rises slightly at low frequencies into the low load, but otherwise the load impedance has very little effect on the preamp's behavior. However, while the midrange THD is very low, at less than 0.02%, it does rise in the top three octaves, reaching 0.2% just below 20kHz. Fig.4 Conrad-Johnson Premier 18LS, THD+noise (%) vs frequency at 1.5V into 100k and 10k ohms (bottom traces), and into 1k ohm (top below 1kHz). (Right channel dashed.) At low frequencies and high levels into 100k ohms, the highest harmonics are the third and fifth (fig.5), with the 120Hz AC supply component visible at -84dB (0.006%). Dropping the load to 1k ohm (fig.6) brings the third harmonic up to -72dB (0.025%), and the second harmonic can now be seen at -80dB (0.01%). At higher frequencies and lower levels, the distortion drops to a very low level (0.0035%, not including the noise contribution). Though the third harmonic is still the highest in level in fig.7, at -90dB it is not going to bother anyone. Fig.5 Conrad-Johnson Premier 18LS, spectrum of 50Hz sinewave, DC-1kHz, at 2V into 100k ohms (linear frequency scale, 10dB/vertical div.). Fig.6 Conrad-Johnson Premier 18LS, spectrum of 1kHz sinewave, DC-1kHz, at 2V into 1k ohm (linear frequency scale, 10dB/vertical div.). Fig.7 Conrad-Johnson Premier 18LS, spectrum of 1kHz sinewave, DC-10kHz, at 1V into 8k ohms (linear frequency scale, 10dB/vertical div.). Despite the rise in THD at high frequencies seen in fig.4, the Premier 18LS produced very low levels of intermodulation distortion with the demanding mixture of 19kHz and 20kHz tones (fig.8). However, the noise floor in figs. 7 and 8 is around 12dB higher than with the tubed Nagra and VTL preamps reviewed in the November issue, despite Conrad-Johnson's use of solid-state devices. The designer's decision not to use overall loop negative feedback results in the 18LS having too much gain for practical use and therefore having a higher noise floor than would otherwise be the case. However, as it is widely felt that the lack of loop negative feedback results in better sound, perhaps due to the feedback shifting the distortion energy to higher-order and therefore more subjectively objectionable components, Bill Conrad and Lew Johnson may well have made the correct choice, to judge from Larry Greenhill's auditioning comments.—John Atkinson Fig.8 Conrad-Johnson Premier 18LS, HF intermodulation spectrum, DC-24kHz, 19+20kHz at 1V into 8k ohms (linear frequency scale).