Sidebar 3: Measurements
I measured the Bryston B1353 with my Audio Precision SYS2722 system (see the January 2008 As We See It). The review sample was not fitted with the optional phono and digital input modules. Before I performed the testing, I preconditioned the amplifier by running it at one-eighth its specified power into 8 ohms for 30 minutes, as recommended by the CEA. After preconditioning, the heatsinks on the amplifier's sides were too hot to touch, at 148.5°F (64.8°C). The top panel was also hot, at 106.4°F (41.4°C). This amplifier needs plenty of ventilation.
The voltage gain at the loudspeaker outputs loaded with 8 ohms with the volume control set to its maximum was 41.1dB, typical of a solid-state integrated amplifier. The maximum gain at the preamplifier outputs was 12.1dB, and at the headphone outputs it was 27.6dB. The power amplifier section can be driven independently; it offered a gain of 29.1dB into 8 ohms. All the inputs and outputs preserved absolute polarity, ie, were noninverting.
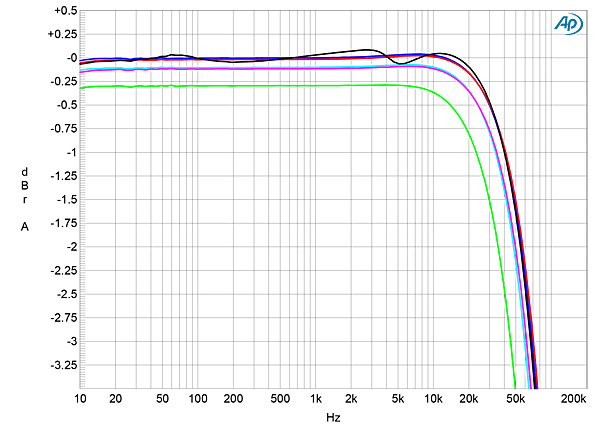
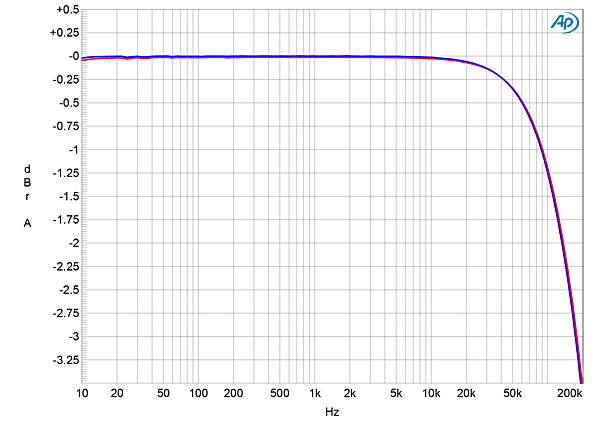
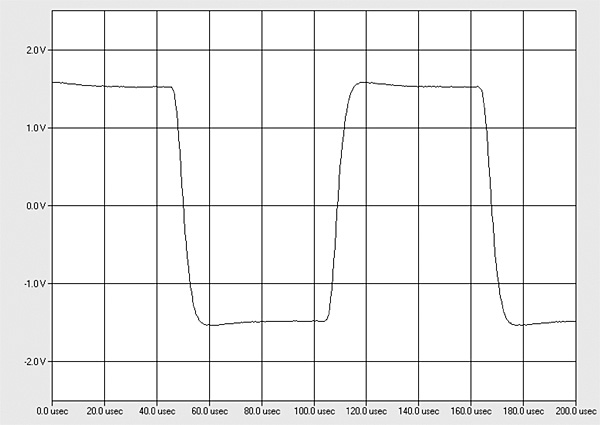
The input impedance at 20Hz and 1kHz was higher than the specified 30k ohms, at 47k ohms, dropping inconsequentially to 42k ohms at 20kHz. The input impedance for the power amplifier section was 30k ohms across the audioband. The output impedance at both the preamplifier and headphone outputs was 71 ohms from 20Hz to 20kHz. The output impedance at the loudspeaker terminals (including the series impedance of 6' of cable) was very low, at 0.09 ohm at 20Hz and 1kHz, rising slightly to 0.15 ohm at 20kHz. The response with our standard simulated loudspeaker therefore varied by just ±0.1dB (fig.1, gray trace). The response into 8 ohms (blue trace) reached –3dB at 65kHz, though the response at the preamplifier and headphone outputs was not down by 3dB until 190kHz (fig.2). These graphs were taken with the volume control set to its maximum; the excellent channel matching was preserved at lower settings of the control. The B1353's reproduction of a 10kHz squarewave (fig.3) featured short risetimes with no overshoot or ringing.
 I examined how the percentage of THD+N varied with output power; clipping was defined as when the THD+noise in the amplifier's output reached 1%. With both channels driven into 8 ohms, the B1353 exceeded its specified maximum power of 135W (21.43BW), clipping at 155Wpc (21.9dB, fig.6). The clipping power into 4 ohms, again with both channels driven, was 230Wpc (20.6dBW, fig.7). With both channels driven, the Bryston clipped at 165Wpc into 2 ohms (16.15dBW, not shown). The downward slope of the traces in figs.6 and 7 indicates that actual distortion decreases beneath the noisefloor at powers below clipping. (A constant amount of noise becomes a smaller percentage of the measured THD+N as the power increases.) I examined how the THD+N percentage varied with frequency at 20V, which is equivalent to 50W into 8 ohms and 100W into 4 ohms. The results are shown in fig.8: The distortion and noise remain very low over most of the audioband, with only small rises in the top and bottom octaves, particularly in the right channel (red and magenta traces).
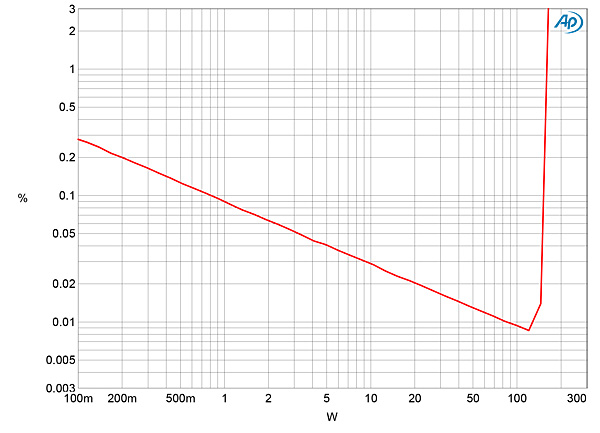
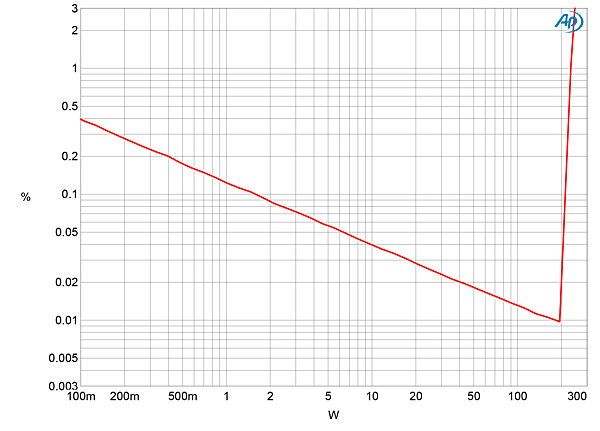
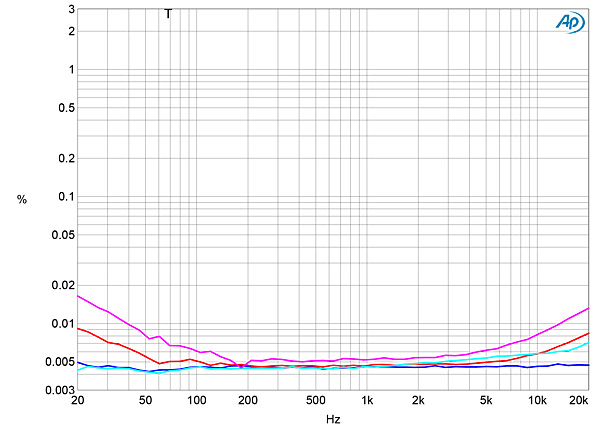
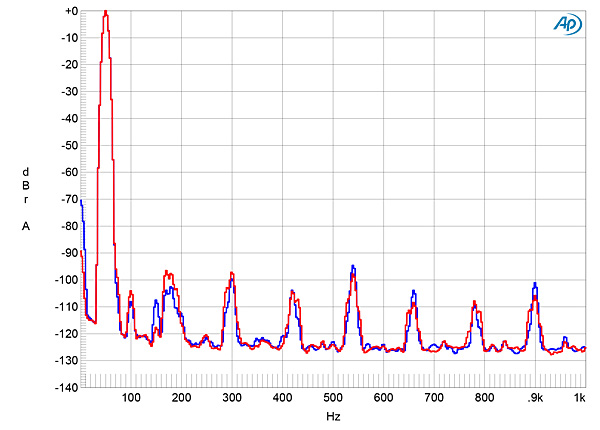
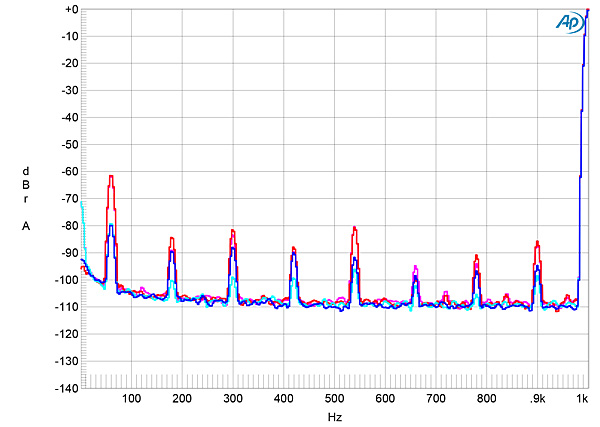
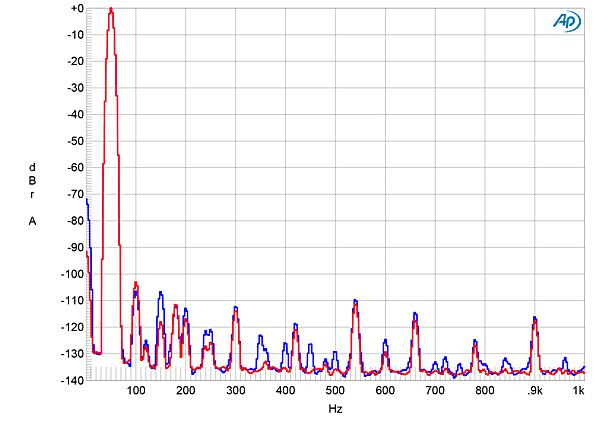 Fig.12 shows the spectrum of the B1353's output as it drove an equal mix of 19 and 20kHz tones into 8 ohms at a peak level of 50Wpc. (I used the power amplifier inputs for this measurement so that actual intermodulation products were not obscured by analog noise.) The second-order difference product at 1kHz and the higher-order intermodulation products all lay close to a negligible –110dB (0.0003%).
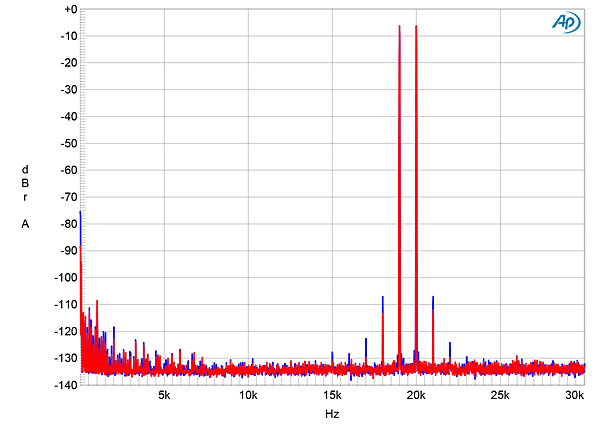
Fig.1 Bryston B1353, frequency response at 2.83V into: simulated loudspeaker load (gray), 8 ohms (left channel blue, right red), 4 ohms (left cyan, right magenta), and 2 ohms (green) (0.5dB/vertical div.).
Fig.1 Bryston B1353, headphone output, frequency response at 1V into 300 ohms (left channel blue, right red) (0.5dB/vertical div.).
Fig.3 Bryston B1353, small-signal, 10kHz squarewave into 8 ohms.
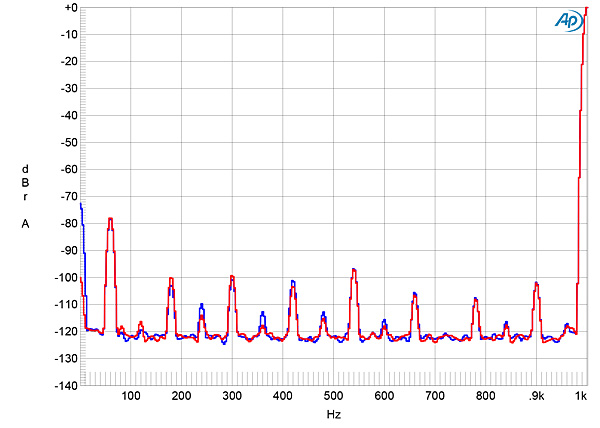
Channel separation was 75dB in both directions below 5kHz, dropping to 67dB at the top of the audioband. Measured with the single-ended inputs shorted to ground and the volume control set to its maximum, the Bryston's wideband, unweighted signal/noise ratio was 66.5dB ref. 1W into 8 ohms in both channels. This ratio improved to 71.7dB when the measurement bandwidth was restricted to 22Hz–22kHz and to 74.4dB when the reading was A-weighted. The magenta and red traces in fig.4, taken at 1Wpc into 8 ohms with the volume control set to its maximum, reveal spuriae at 60Hz and its odd-order harmonics. Reducing the volume control by 20dB and increasing the input voltage to give the same 1Wpc into 8 ohms (cyan and blue traces) reduces the level of these spuriae by 20dB, which suggests they may be due to the preamplifier circuitry picking up magnetic interference from the power transformer.
Fig.4 Bryston B1353, spectrum of 1kHz sinewave, DC–1kHz, at 1Wpc into 8 ohms with volume control set to maximum (left channel magenta, right red) and set to –20dB (left cyan, right blue) (linear frequency scale).
Repeating the spectral analysis with the power amplifier section driven directly (fig.5) indicated that the primary spurious tone was 60Hz at –80dB (0.01%). The signal/ noise ratio with this input shorted to ground (average of both channels and again ref. 1W into 8 ohms) was 77dB (wideband, unweighted), 86.6dB (22Hz–22kHz), and 89.3dB (A-weighted). This supports my supposition that the higher level of noise with the volume control set to its maximum is due to the B1353's preamplifier section.
Fig.5 Bryston B1353, power amplifier input, spectrum of 1kHz sinewave, DC–1kHz, at 1Wpc into 8 ohms (left channel blue, right red) (linear frequency scale).
Fig.6 Bryston B1353, THD+N (%) vs 1kHz continuous output power into 8 ohms.
Fig.7 Bryston B1353, THD+N (%) vs 1kHz continuous output power into 4 ohms.
Fig.8 Bryston B1353, THD+N (%) vs frequency at 20V into: 8 ohms (left channel blue, right red), 4 ohms (left cyan, right magenta).
The waveform of the THD+N at 50Wpc into 8 ohms after the 1kHz fundamental had been notched out (fig.9) suggests that the third harmonic is the highest in level; it is overlaid with analog noise. However, when I examined the spectrum of the Bryston's output as it drove 50Hz at 50Wpc into 8 ohms (fig.10), the second harmonic lay at –106dB (0.0005%), which was a little higher than the third harmonic in the left channel (blue trace). If higher-order harmonics are present, they are obscured by the power supply–related spuriae. (This graph was taken with the volume control set to its maximum.) Repeating the spectral analysis using the power amplifier inputs (fig.11) confirmed that the second harmonic was the highest in level and that the third harmonic was a little higher in the right channel than the left, at –108dB vs –119dB. All the values are very low.
Fig.9 Bryston B1353, 1kHz waveform at 50Wpc into 8 ohms, 0.0044% THD+N (top); distortion and noise waveform with fundamental notched out (bottom, not to scale).
Fig.10 Bryston B1353, spectrum of 50Hz sinewave, DC–1kHz, at 50Wpc into 8 ohms (linear frequency scale).
Fig.11 Bryston B1353, power amplifier input, spectrum of 50Hz sinewave, DC–1kHz, at 50Wpc into 8 ohms (linear frequency scale).
Fig.12 Bryston B1353, power amplifier input, HF intermodulation spectrum, DC–30kHz, 19+20kHz at 50Wpc peak into 8 ohms (linear frequency scale).
The Bryston B1353 offers extremely low levels of distortion. Background noise will be at its lowest when the volume control is below the maximum.—John Atkinson


