Sidebar 3: Measurements
A full set of measurements of the Audio Research VT100 was made using its balanced inputs, with selected measurements repeated in the unbalanced mode, as noted below.
Following preconditioning/warm-up, the VT100 was very hot, though not hotter than the normally expected range for a tube amplifier. The Audio Research VT100's input impedance measured 178k ohms (98.9k ohms, unbalanced). The output impedance (at the 8 ohm taps) measured a maximum of 1.26 ohms at 20Hz and 1kHz, and 1.54 ohms at 20kHz. Voltage gain measured 23.8dB into 8 ohms (and an almost identical 23.9dB, unbalanced). Signal/Noise ratio (ref. 1W into 8 ohms) measured 78.2dB over a 22Hz–22kHz bandwidth and 78dB over a 10Hz–500kHz bandwidth, both unweighted; and 91.4dB, A-weighted.
The VT100 is noninverting when driven from its unbalanced input; at the balanced, XLR input terminal, pin 2 is positive. DC offset measured 5mV in the left channel and 4mV in the right.
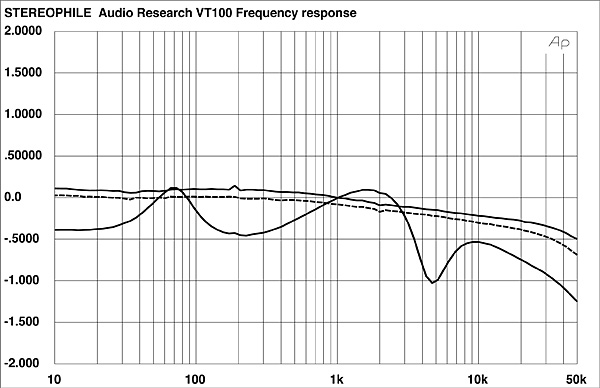
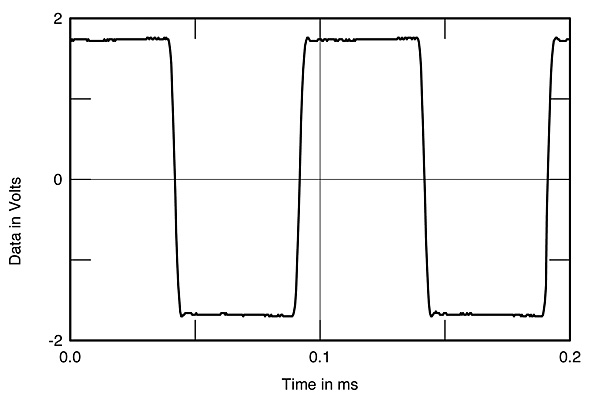
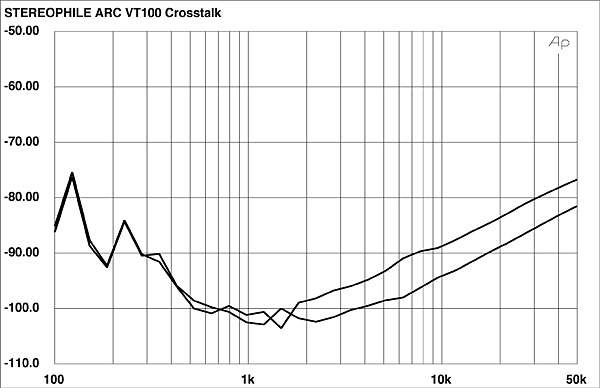
Fig.1 shows the frequency response of the VT100. The balanced response at 1W into 8 ohms is shown; the unbalanced response, and the response into other fixed resistive loads, was virtually identical. The response into a simulated real load (bottom traces in fig.1) was typical of an amplifier with a moderately high output impedance. The 10kHz squarewave response (fig.2) has good risetime with one cycle of damped overshoot. (The 1kHz squarewave, not shown, is moderately rounded at the leading edge.) Fig.3 shows the VT100's crosstalk—a very good result.
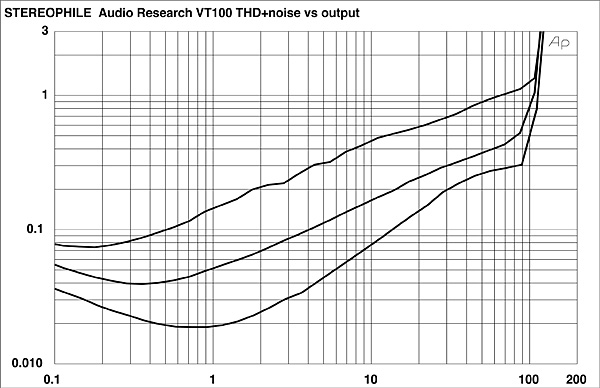
 The THD+noise vs frequency curves are plotted in fig.4. Note that our 8 ohm tests were run from the 8 ohm tap, the 4 ohm from the 4 ohm tap, the simulated real load from the 4 ohm tap, and the 2 ohm from the 4 ohm tap. Since there is no 2 ohm tap, the noticeably higher THD with a 2 ohm load reflects the mismatch of driving a 2 ohm load from a 4 ohm tap (most loudspeakers that approach 2 ohms, however, do so only in a narrow band of the frequency range). Except for the rise in THD below 100Hz in some of the curves, this is a very good result.
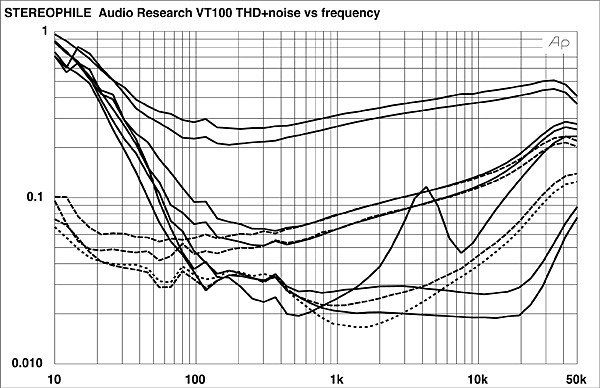
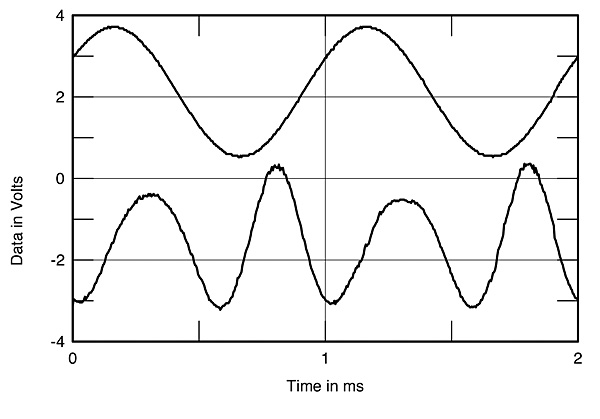
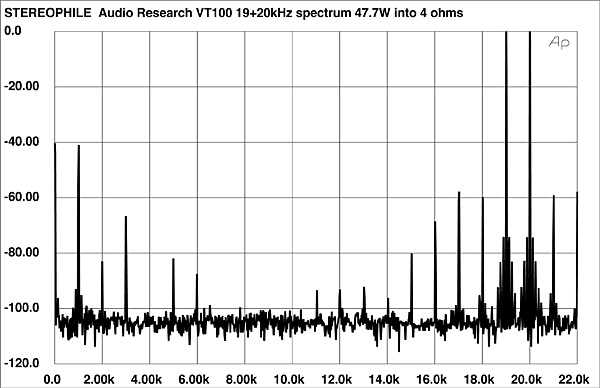
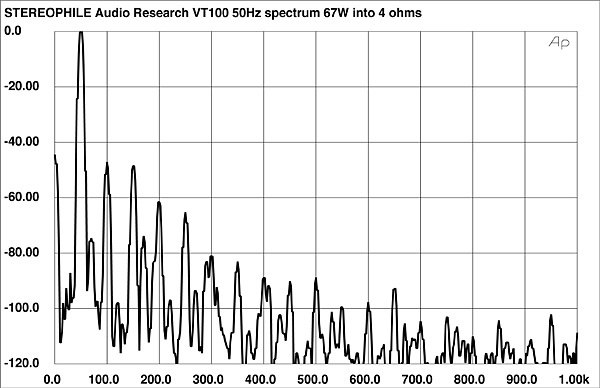 Fig.7 shows the output spectrum with a combined 19+20kHz signal—it shows the intermodulation products resulting from an equal combination of these two frequencies—at 47.7W into 4 ohms (visible clipping is present above this output with this signal). The largest component is at 1kHz ($*–41dB, or about 1%). The result at 50W into 8 ohms (not shown) is slightly better at 1kHz, a little worse at 2kHz.
AC powerline voltage: 119V
Fig.1 Audio Research VT100, 8 ohm tap, frequency response at (from top to bottom at 20kHz): 1W into 8 ohms, and 2.83V into simulated speaker load (right channel dashed, 0.5dB/vertical div.).
Fig.2 Audio Research VT100, small-signal 10kHz squarewave into 8 ohms.
Fig.3 Audio Research VT100, crosstalk (from top to bottom at 2kHz): R–L, L–R (10dB/vertical div.).
Fig.4 Audio Research VT100, THD+noise vs frequency at (from top to bottom at 10kHz): 4W into 2 ohms, balanced, 4 ohm tap; 4W into 2 ohms, unbalanced, 4 ohm tap; 2W into 4 ohms, balanced, 4 ohm tap; 2W into 4 ohms, unbalanced, 4 ohm tap; 1W into 8 ohms, balanced, 8 ohm tap and 1W into 8 ohms, unbalanced, 8 ohm tap (right channel dashed).
The waveform of the distortion at 2W into 4 ohms is shown in fig.5. It is heavily second-harmonic, with limited higher-order components. The waveforms (not shown) into 4 and 8 ohms were similar.
Fig.5 Audio Research VT100, 1kHz waveform at 2W into 4 ohms, 4 ohm tap (top); distortion and noise waveform with fundamental notched out (bottom, not to scale).
The VT100's output spectrum reproducing a 50Hz input at 67W into a 4 ohm load is shown in fig.6. The distortion products are relatively low in level—the highest are at 100 and 150Hz, at about $*–48dB (0.4%). The result into a simulated real load was similar, though with a slightly lower distortion at 100Hz and slightly higher at 150Hz.
Fig.6 Audio Research VT100, 8 ohm tap, spectrum of 50Hz sinewave, DC–1kHz, at 67W into 4 ohms (linear frequency scale).
Fig.7 Audio Research VT100, 8 ohm tap, HF intermodulation spectrum, DC–22kHz, 19+20kHz at 47.7W into 4 ohms (linear frequency scale).
The 1kHz, THD+noise vs output curves for the VT100 are shown in fig.8. The discrete clipping levels for the VT100 are shown in the Table.
Fig.8 Audio Research VT100, distortion (%) vs output power into (from bottom to top at 100W): 8 ohms, 8 ohm tap; 4 ohms, 4 ohm tap; and 2 ohms, 4 ohm tap.
Other than driving a 2 ohms load from the 4 ohm tap, the VT100 exceeds its 100Wpc specification at our standard 1% THD+noise percentage, at least from its left channel. The VT100 was tested with the same set of tubes used by BJR for his review. From Table 1, it appears that one or more tubes in the right channel were suboptimal, resulting in a lower power output. I would not expect the difference to be audible in normal use. Apart from this and a small rise in THD below 100Hz in some of the curves (below 1% in any case), the Audio Research VT100 produced a solid set of measurements.—Thomas J. Norton
Table: Discrete Clipping levels (1% THD+noise at 1kHz)| Impedance W (dBW) | Both Channels Driven | One Channel Driven W (dBW) L R L | |
| 8 ohms | 109.7 (20.4) | 96.2 (19.8) | 112.5 (20.5) |
| 4 ohms | 108.4 (17.4) | 85.6 (16.3) | 111.8 (17.5) |
| 2 ohms | 66.3 (12.2) | ||


