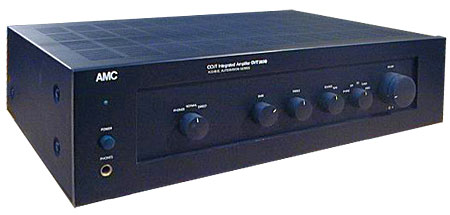
Sidebar 1: Measurements
All the results shown here are for the Direct setting, unless otherwise noted. Following the standard one-hour, one-third power preconditioning, the top cover of the AMC CVT-3030 was very warm, but not uncomfortable to touch. Beginning with the amplifier's line-stage, its output impedance at its 8 ohm taps measured just over 1 ohm, with insignificant load- and frequency-related variations. From the 4 ohm taps it was slightly lower at 0.7 ohms at 20Hz and 1kHz, increasing to a maximum of 1.3 ohms at 20kHz. The line input impedance was just over 20k ohms, the maximum gain 37.7dB. The output impedance of the tape outputs, with a source impedance of 25 ohms, was 988 ohms; with a source impedance of 600 ohms, the tape output impedance was 1477 ohms. This suggests resistance in the tape output circuit, but no active buffering. (With active buffering the tape monitor output impedance would be unchanged with a change in source impedance.)
Perhaps due to very–low-frequency noise, it was difficult to assess DC offset at the 3030's output. This fluctuated considerably—and rapidly—in both channels, making the reading difficult; my calibrated eyeballs judged it to range between 0.3mV and 40mV in both channels. The 3030 is noninverting through both its line and phono inputs, and its S/N ratio (unweighted) measured 69dB in the Normal setting, 68dB in the Direct (the reverse of what might be expected, presumably due to additional band-limiting outside the audio band in the Normal mode) at a reference level of 1W into 8 ohms.
Fig.1 shows the line-level frequency response of the AMC. The top pair of traces are into 8 and 4 ohm loads from the 8 ohm taps, the bottom pair from the 4 ohm taps. Note that the response from the former holds up well to 40kHz, after which it drops off abruptly. The response from the 4 ohm taps rolls off smoothly, but the drop is more pronounced below 20kHz and thus is more likely to have audible consequences by softening the top octave.
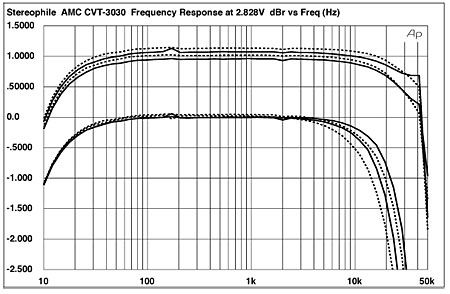
Fig.1 AMC CVT-3030, Direct Mode, frequency response at 2.83V into (from top to bottom): 8, 4 ohms, 8 ohm tap; 8, 4 ohms, 4 ohm tap (0.5dB/vertical div., right channel dashed).
The 3030's squarewave responses are shown in figs.2 and 3, taken from the 8 ohm tap into an 8 ohm load. Fig.2 is a 1kHz squarewave taken at the 3030's Normal setting, with tone controls engaged but centered (flat). A slight amount of ultrasonic high-frequency ringing is visible at the leading edge, with a small downward slope at the top indicating the low-frequency rolloff (in the Direct setting—not shown—there is still visible ringing, but to a much smaller degree). Fig.3 shows a 10kHz squarewave in the same, Normal setting. Here the ultrasonic overshoot and ringing are more apparent. The Direct setting (not shown) has less ringing. It's well-damped, however, and is high enough in frequency (around 100kHz) that it is unlikely to have audible consequences.

Fig.2 AMC CVT-3030, Normal mode, small-signal 1kHz squarewave into 8 ohms (8 ohm tap).

Fig.3 AMC CVT-3030, Normal mode, small-signal 10kHz squarewave into 8 ohms (8 ohm tap).
Fig.4 indicates the response of the 3030 with the tone controls engaged; both maximum boost-and-cut and one-quarter boost-and-cut settings are shown. Note that at the smaller rotation the resulting curves are almost shelving in nature. Fig.5 shows the frequency response, still in the Normal setting, tone controls engaged, but here with the controls centered (flat) at the 8 ohm taps. The center positions are not very well calibrated. Clearly, if you're not actually using the tone controls, you'd be well advised to use the 3030's Direct setting.

Fig.4 AMC CVT-3030, effect of tone controls set to maximum, minimum, and ¼ settings, 8 ohm tap (0.5dB/vertical div., right channel dashed).

Fig.5 AMC CVT-3030, Normal mode, frequency response at 2.83V into (from top to bottom): 8, 4 ohms, 8 ohm tap (0.5dB/vertical div., right channel dashed).
The tracking of the level control was good, however, with a maximum channel difference of 0.7dB occurring at one-quarter rotation. The line-input crosstalk (fig.6) is reasonably good, with the typically encountered increase at higher frequencies caused by capacitive coupling. But note the interesting contrast between the top and bottom pairs of curves: the crosstalk is actually
lower in the Normal position, though less consistent from channel to channel.

Fig.6 AMC CVT-3030, line-input/power amplifier channel separation (from top to bottom) at 1kHz: R–L, L–R, Direct mode; R–L, L–R, Normal mode;8, 4 ohms (5dB vertical div.).
The curves in fig.7 (8 ohm tap) indicate suitably low levels of distortion in the midrange but an increase at higher and lower frequencies, this typical of circuits using tubes and an output transformer. The extra current drawn by lower impedance loads also results in a rise in distortion. There is generally lower distortion from the 4 ohm tap (fig.8). The THD+noise waveform for 4W into 2 ohms from the 8 ohm tap (fig.9) indicates a primarily third-harmonic component plus noise which, subjectively, will be relatively innocuous. Into 8 ohms and 4 ohms and from the 4 ohm tap (not shown), the distortion was still primarily third-harmonic.

Fig.7 AMC CVT-3030, 8 ohm tap, THD+N (%)
vs frequency at 2.83V into (from bottom to top): 8, 4, 2 ohms (right channel dashed).

Fig.8 AMC CVT-3030, 4 ohm tap, THD+N (%)
vs frequency at 2.83V into (from bottom to top): 8, 4, 2 ohms (right channel dashed).

Fig.9 AMC CVT-3030, 8 ohm tap, 1kHz waveform at 4W into 2 ohms (top); distortion and noise waveform with fundamental notched out (bottom, not to scale).
This was reinforced by the plot showing the spectrum of the '3030's output when driving a 50Hz tone into 4 ohms at a level of 20W (fig.10) using the 8 ohm tap. The second harmonic lies at –67dB (about 0.045%) with the third harmonic noticeably higher at –42dB (0.8%). The remaining harmonics fall off with increasing frequency (the next highest being 250Hz at –64.5dB or 0.06%, and 350Hz at –73.5dB or 0.02%). Various power-line noise artifacts at 60Hz and its harmonics are also visible, though low in level. The result measured from the 4 ohm tap (not shown) was similar, with the artifacts just slightly lower in level and showing the same general trend with increasing frequency.
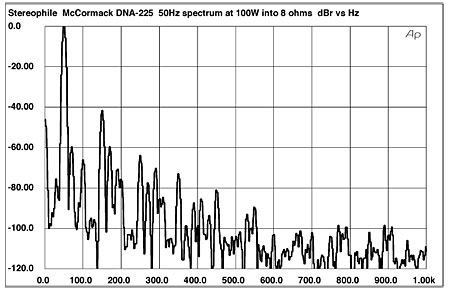
Fig.10 AMC CVT-3030, 8 ohm tap, spectrum of 50Hz sinewave, DC–1kHz, at 20W into 4 ohms (linear frequency scale).
A similar spectral plot is shown in fig.11, this time the result of the amplifier driving an equal mix of 19kHz and 20kHz tones at 15.9W—just below visible waveform clipping with this signal—into an 8 ohm load from the 8 ohm tap. The graph shows the intermodulation between these two frequencies. The highest artifact is the 1kHz difference frequency (at –54dB, or 0.2%) followed by 17kHz (–56dB, or about 0.15%) and 21kHz (roughly the same at –57dB). Into a 4 ohm load from the 8 ohm tap (not shown), the artifacts were several dB higher at 18kHz and 21kHz, slightly lower at 1kHz and 17kHz (at 15.7W, again just prior to visible clipping). The results from the 4 ohm tap were similar, with the primary difference being a considerably smaller 1kHz artifact (–67dB or 0.045% into a 4 ohm load, and –71.4dB or about 0.025% into an 8 ohm load). These figures emphasize the importance of matching the amplifier's output tap to the speaker's nominal impedance rating to get the lowest distortion.

Fig.11 AMC CVT-3030, 8 ohm tap, HF intermodulation spectrum, DC–22kHz, 19+20kHz at 15.9W peak into 8 ohms (linear frequency scale).
The manner in which the THD+noise level changes with output power (at 1kHz) is shown in fig.12 (8 ohm tap) and fig.13 (4 ohm tap). (Below the minimum distortion level between 1 and 2W output, the measured figure is dominated by noise; above that level, it is dominated by true distortion harmonics.) Note again that the optimum balance of maximum output with minimum distortion results from matching the load impedance to the output tap. With an actual loudspeaker load, of course, the situation is more complex—because the impedance itself is complex—requiring some experimentation to find the optimum match. The discrete clipping power measurements (Table 1) merely reinforce that result. They also indicate the amplifier has no problem meeting its specification, using the appropriate output transformer tap.
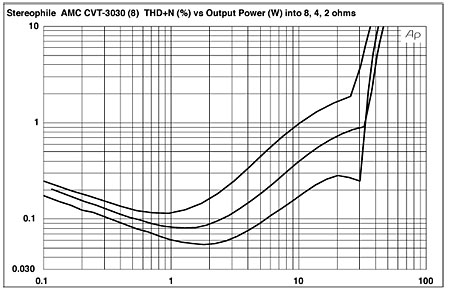
Fig.12 AMC CVT-3030, 8 ohm tap, distortion (%)
vs 1kHz continuous output power into (from bottom to top): 8, 4, 2 ohms.

Fig.13 AMC CVT-3030, 4 ohm tap, distortion (%)
vs 1kHz continuous output power into (from bottom to top): 8, 4, 2 ohms.
TABLE 1: AMC CVT-3030 Clipping
(1% THD+N at 1kHz)
| Both Channels Driven | One Channel Driven |
| Load | | W (dBW) | W (dBW) |
| ohms | (L) | (R) | (R) |
| 8 ohm tap | | | |
| 8 | 32.3 (15.1) | 30.9 (14.9) | 32.9 (15.2) |
| (line) | 122V | 120V | 120V |
| 4 | 24.4 (10.9) | 21.7 (10.4) | 34.7 (12.4) |
| (line) | 121V | 120V | 121V |
| 2 | | | 10.0 (4.0) |
| (line) | | | 123V |
| 4 ohm tap | | | |
| 8 | 20.5 (13.1) | 20.6 | 20.8 (13.2) |
| (line) | 122V | 120V | 120V |
| 4 | 31.6 (12.0) | 30.8 (11.9) | 33.0 (12.4) |
| (line) | 121V | 120V | 121V |
| 2 | | | 36.0 (9.5) |
| (line) | | | 123V |
Moving over to the 3030's MM phono input—all phono measurements were made at the tape outputs—the RIAA error (fig.14) is impressively small. The phono crosstalk, taken at a 75mV input level (at 1kHz) to minimize the effect of noise, is not shown but smoothly rose from –100dB at 100Hz to –78dB at 20kHz. This is a first-rate result, the increasing crosstalk with frequency likely due to interchannel capacitive coupling. Finally, fig.15 shows the THD+noise
vs frequency for the phono input with input voltages of 5mV (top curves) and 75mV (bottom curves). The 75mV used for the bottom curves minimized the contribution of noise to the result. The top curves—for a 5mV input—are included here to show that although the noise at this level (typical for a moving-magnet cartridge) increases the overall reading, the THD+noise is
still very low. The phono-stage overload point (1% THD+noise) was very high, reached with an unequalized input signal at 155mV at 1kHz, 16.4mV at 20Hz, and 1.47V at 20kHz—the differences are due to the characteristics of the RIAA phono equalization curve. These are equivalent to overload margins of 29.8dB, 30.3dB, and 29.4dB, respectively. CVT-3030 owners need not fear using high-output MM or MC cartridges. The phono-stage gain is 35.8dB.

Fig.14 AMC CVT-3030, phono-stage RIAA error (0.5dB/vertical div., right channel dashed).

Fig.15 AMC CVT-3030, phono-stage, THD+N (%)
vs frequency at (from top to bottom), 5mV at 1kHz (dominated by noise), 75mV at 1kHz (right channel dashed).
The bench results of the CVT-3030 are very respectable for a relatively low-powered (and low-priced) tube integrated amplifier. I was most impressed by the phono-stage measurements—hardly inferior to any number of stand-alone (and generally more expensive) tube preamps we have tested.—
Thomas J. Norton