| Columns Retired Columns & Blogs |
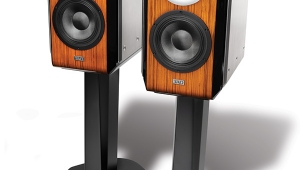
Acoustic Energy AE2 loudspeaker Measurements
Sidebar 2: Measurements
Regarding measurements, I use a mixture of nearfield, in-room, and quasi-anechoic FFT techniques (using the MLSSA system from DRA Labs described elsewhere in this issue) to investigate objective factors that might explain the sound heard. The speakers' impedance phase and amplitude were measured using the magazine's Audio Precision System One.
The AE2's impedance curve (fig.1) reveals the port tuning to lie at 42Hz. The use of two 8 ohm woofers means that the minimum impedance drops to 4 ohms in the upper-bass/lower-midrange, though it remains above 6 ohms above 600Hz.
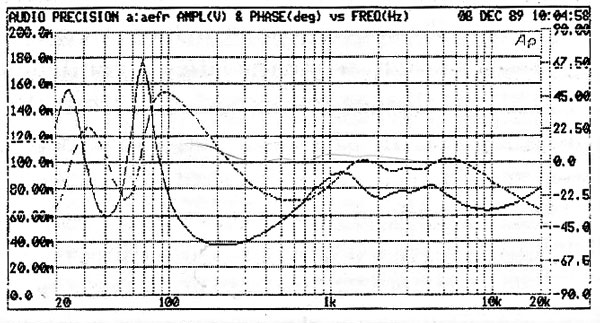
Fig.1 Acoustic Energy AE2, electrical impedance (solid) and phase (dashed) (2 ohms/vertical div.; note that the phase angle is inverted in this graph).
The AE2's impulse response, calculated by the MLSSA software from the Maximum-Length-Sequence data taken with a 30kHz bandwidth on the tweeter axis at a distance of 48", is shown in fig.2. Overlaid with ultrasonic ringing from the tweeter's high-Q "oil-can" resonance, it suggests that the drive-units are connected with the same electrical polarity. Low-pass filtering the impulse response gives a shape that implies a degree of midband emphasis. Performing a Fast Fourier Transform on the anechoic section of this impulse response gives the AE2's anechoic frequency response (with a resolution of a hair over 200Hz), which is shown to the right of fig.3. An overall flat response on this axis is broken up by narrow suckouts centered on 1kHz and 3.5kHz, with slight peaks above those frequencies. The response starts to roll off above 16kHz, but is then interrupted by the tweeter resonance at 24.59kHz, which rises more than 10dB above the reference level. This resonance should be inaudible, however.
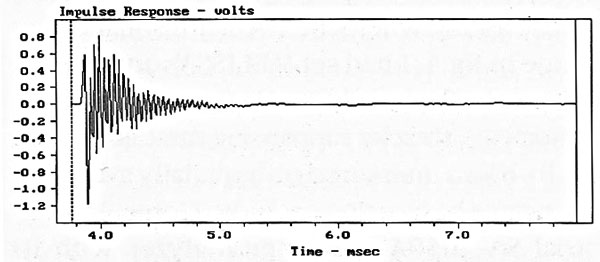
Fig.2 Acoustic Energy AE2, impulse response on tweeter axis at 48" (5ms time window, 30kHz bandwidth).
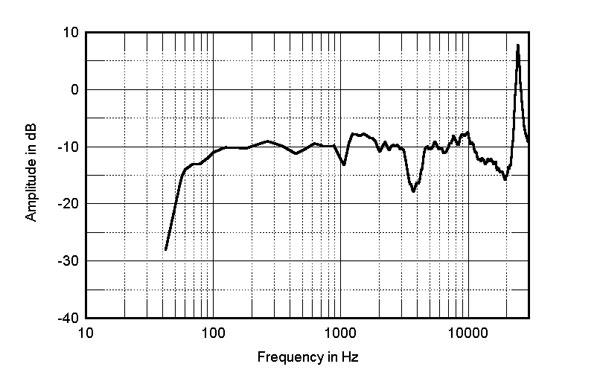
Fig.3 Acoustic Energy AE2, anechoic response on tweeter axis at 48", with nearfield woofer response.
To the right of fig.3 is shown the nearfield response of one of the woofers: this reaches a half-power point with respect to the level at 200Hz at 65Hz, which is quite high. This, however, doesn't include the output from the three small ports, which, to judge from the impedance plot (fig.1), should extend the half-power frequency to 45Hz or so.
The AE2's asymmetrical drive-unit array means that its off-axis behavior will be different to either side. Fig.4 shows the anechoic responses taken on the tweeter axis 15° off-axis to the two sides. The top trace is that to the side with the two woofers, whereas the lower is that to the tweeter edge of the cabinet. It can be seen that the former, while sharing most of the features of the anechoic trace in fig.3, lacks the crossover notch, while the latter accentuates it. This reinforces my experience from the listening that the AE2s sounded best with the tweeters on the outside edges of the speakers. (This is specific to my room, however, where the side walls are a long way from the speaker positions. If the AE2s are used in a room where the side walls are in close proximity, it might be better to place the speakers with their tweeters on the inside edges.) Incidentally, for those asking where the tweeter resonance has gone in fig.4, I had set MLSSA's antialiasing filter to be flat to only 20kHz for these two measurements, thereby suppressing the 25kHz peak.
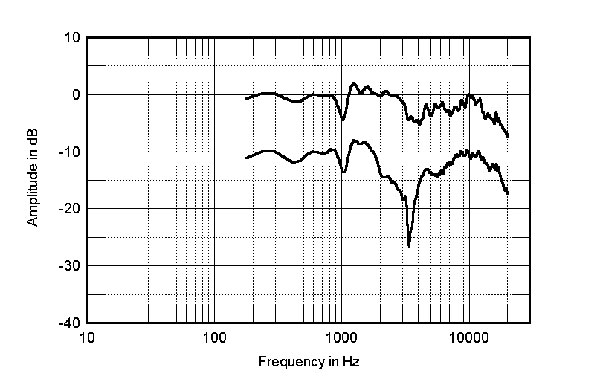
Fig.4 Acoustic Energy AE2, anechoic response at 48" on axis 15° on woofer side of tweeter (top) and 15° on tweeter side (bottom).
In-room, measured on a spatially averaged, 1/3-octave basis using an Audio Control Industrial SA-3050A spectrum analyzer with its calibrated microphone, it can be seen that the AE2's ports only boost the bass output by a small amount (the small dimple centered on 40Hz superimposed upon the overall falling trend below 125Hz in fig.5). Therefore, though the auditioning suggested excellent subjective bass weight, the AE2 must still be considered a minimonitor. As suggested by the listening tests, measurement confirms that the overall midrange output is boosted compared with the treble, though not to anything like the extent found by Martin Colloms in his review in the January 1989 HFN/RR, which indicated that the HF unit's output was depressed by 5dB. The treble, in fact, measures as being commendably flat, with only slight lacks of energy centered on 1kHz, 3kHz, and 16kHz spoiling the smooth trend in-room.
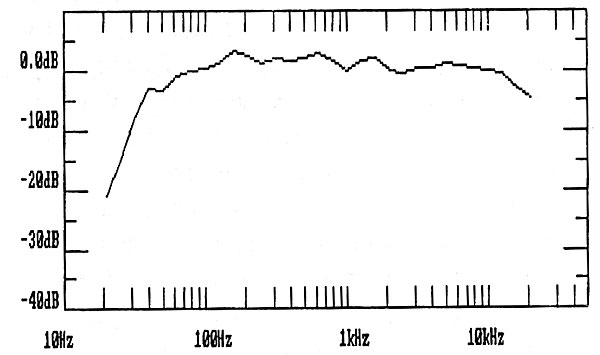
Fig.5 Acoustic Energy AE2, spatially averaged, 1/3-octave response in JA's Santa Fe room.
The postprocessing power offered by MLSSA enables you to examine the spectral decay of the computed impulse response—ie, you can see how the response changes with time after the exciting pulse has been and gone, revealing the presence of resonances by the way in which they persist. Fig.6 shows the "waterfall" plot for the AE2. The two most obvious features are the tweeter resonance and the suckouts at 1kHz and 3kHz: the calculated response at time zero in fig.6 is actually identical to that shown in fig.3. Note how the ultrasonic tweeter resonance is depicted as a "ridge" whose height decreases with time. Apart from that, the entire tweeter region decays very quickly and cleanly, correlating with my feeling from the auditioning that the AE2's high frequencies were, indeed, very clean-sounding.
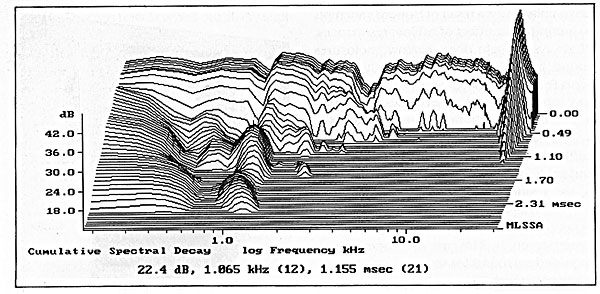
Fig.6 Acoustic Energy AE2, cumulative spectral-decay plot on listening axis at 48" (0.15ms risetime).
That the depression centered on 3kHz is due to interference between the tweeter and woofers is revealed by the fact that that frequency band also decays quickly. But look at the 1kHz suckout: as the pulse decays, a ridge appears at the exact center frequency of the suckout, revealing that it is actually associated with a resonance. This, perhaps, is associated with the slightly "hooty" quality noted on trumpet and piano, as well as the "eee" nature of strings. (Because of the dependence of this coloration on associated components, however, it could also be a function of the exact balance between midrange and highs.)—John Atkinson
- Log in or register to post comments
