| Columns Retired Columns & Blogs |
A Case of the Jitters
"How sour sweet music is / When time is broke and no proportion kept!"
—William Shakespeare, King Richard II, V, v, 42
Footnote 1: The test signal used to trigger the measurement was a 1kHz tone at an input level that produced digital data peaking at –3dBFS. Higher than that and the Audio Precision's autoranging circuit reduced the input gain, meaning that the SYS2722's A/D converter might well be up to 3dB quieter than the result plotted here.
—William Shakespeare, King Richard II, V, v, 42
"Bits is bits!" goes the cry from skeptics when audiophiles criticize digital sound. In other words, the digital bits that constitute the music, as they make their way from disc to sound via the technological marvel of digital/analog conversion, are immune to the slings and arrows of outrageous analog fortune. What is often forgotten is the fact that not only must the amplitude—ie, what the bits describe—of the converted analog signal be correct, but the timing of the conversion of each digital word to analog must also be correct. The right bits at the wrong time are equivalent to the wrong bits at the right time. And if the bits are, as a result of the timing uncertainty in the conversion to analog, the wrong bits, then the recovered analog signal will be distorted, and will not sound as good as predicted.
The timing uncertainty in a digital audio system is called "jitter," and was described in full in a tutorial article by Barry Blesser in the October 1978 issue of the Journal of the Audio Engineering Society. (That issue, which was devoted to an examination of the then imminent launch of digital audio media, is still available from the Audio Engineering Society website.) Jitter is generally expressed as a number of nanoseconds (ns or 10–9 second) or picoseconds (ps or 10–12 second). These are very small intervals of time—in 1ns, light travels just 0.1"—but digital audio theory predicts that jitter needs to be below 100ps for 16-bit (ie, CD) audio to be reproduced without degradation—and 24-bit audio requires jitter to be below 10ps!
Stereophile has published a number of articles on the theory and effect of jitter on audio quality, all of which are available in the magazine's website archives. Robert Harley wrote about "Jitter, Errors & Magic" in May 1990, as did I in December 1990, in "Jitter, Bits & Sound Quality." RH returned to the subject in January 1993 with "The Jitter Game," and in November 1993 with "A Transport of Delight." The theoretical aspects of jitter were examined by Rémy Fourré in "Jitter & the Digital Interface" in October 1993, and by Chris Dunn and Malcolm Omar Hawksford in "Bits Is Bits?" in March 1996.
The distortion associated with jitter is not the usual generation of spurious harmonics, which can be measured with a conventional distortion analyzer, but instead comprises sidebands surrounding every musical tone, with the level of those sidebands proportional to both the amplitude of the jitter and the frequency of the musical tone, and their frequency spacing proportional to the frequency content of the jitter. Measuring the effect of jitter is therefore far from a simple matter.
The J-Test, where J stands for jitter, was developed in the mid-1990s by the late Julian Dunn of PrismSound to investigate the jitter rejection of digital datalinks in which the clock is embedded in the audio data: the balanced AES/EBU or AES3 link, for example, or the unbalanced S/PDIF link. The test signal comprises a high-level tone at exactly one-quarter the sample frequency, or Fs/4, to which is added a squarewave at the level of the least significant bit (LSB), at Fs/192. With the twos-complement PCM encoding used by CD data, this low-level squarewave exercises all the bit transitions simultaneously, which is very much the worst case for stimulating jitter. The high-level, high-frequency tone is thus modulated by the jitter and sidebands spaced at the frequency of the Fs/192 squarewave, and its harmonics will appear in the reconstructed analog signal's noise floor.
With CD data, the high-level tone has a frequency of 44.1/4kHz = 11.025kHz, while the squarewave has a frequency of 44,100/192 = 229.6875Hz. The digital-domain waveform of this signal is shown in fig.1, with the data values shown as red dots and the analog waveform that would be reconstructed by the anti-aliasing low-pass filter as the blue trace. Something that is little appreciated is that because both test signals are exact even-integer fractions of the sample rate, there is therefore no quantizing noise/distortion. Any spuriae that appear in the reconstructed analog noise floor are due to the behavior of the device under test. Fig.2 shows the spectrum of the J-Test signal as decoded by a perfect 16-bit device (red and blue traces). Note that between the spectral lines, there is no noise at all above the –150dB floor of this graph.

Fig.1 Waveform of 16-bit Dunn analytical J-Test signal, fundamental frequency 11.025kHz, sample rate 44.1kHz.
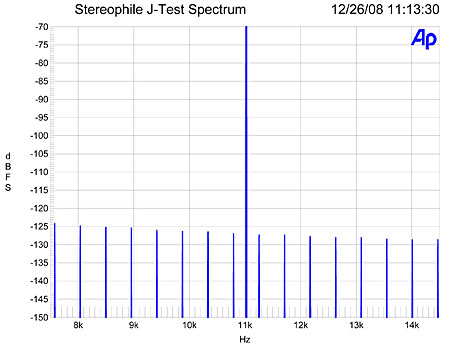
Fig.2 Spectrum of 16-bit signal shown in fig.1. Center frequency of trace, 11.025kHz; frequency range, ±3.5kHz (left channel blue, right red).
However, there is a problem with the frequencies chosen for the J-Test, as the Fs/4 tone occurs exactly midway between two of the odd-order harmonics of the Fs/192 LSB squarewave. Thus, once the jitter gets low enough, the true sidebands (with 44.1kHz data) at ±229.6875Hz (and its multiples) cannot be distinguished from the naturally occurring odd harmonics at 10,795.3125Hz and 11,254.6875Hz, etc. This is why I refer in my reviews to the "residual" level of the data-related products.
In the early 1990s, Stereophile used Ed Meitner's LIM Detector to measure digital components' susceptibility to jitter. In some ways, it was the best way of doing this, as its probes were attached to the pins of the D/A chip that actually controlled the timing of the D/A conversion and it directly decoded the frequency modulation that resulted from timing uncertainty. However, determining which pins those were was far from trivial, and there was always the possibility that the performance of the product was affected by the presence of the probes.
In 1997, we started using the Miller Audio Research Jitter Analyzer, a National Instruments Labview program that makes use of a high-performance A/D and DSP card (originally AT-bus, then PCI-bus) housed in a PC. The National Instruments card is connected to the player's or processor's analog output while it decodes the Dunn J-Test signal. The Miller software then searches a high-resolution, FFT-derived spectrum of the device's noise floor for identifiable symmetrical sidebands in order to then calculate a jitter total. However, the NI cards that are the basis for the Miller Analyzer use 16-bit A/D converters. Although the Miller software uses extensive signal averaging to lower the contribution of these converters' self-noise, it limits the system's resolution to around 120 picoseconds of jitter, which is higher than the jitter of the very best digital audio products now available.
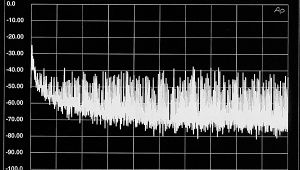
In 2007, I took delivery of a loaner sample of Audio Precision's top-of-the-line SYS2722 measurement system (see www.ap.com and "As We See It" in the January 2008 issue). While the AP software lacks the ability to search an analog signal for sidebands, the '2722 uses 24-bit A/D converters to examine analog signals. With disc players and processors, therefore, the analyzer's noise floor will be below that of the device under test, allowing a much clearer look at what is happening. Fig.3, for example, shows a spectral analysis of the SYS2722's converter noise floor (footnote 1), plotted to the same scale and limits as the graphs shown in the three "Test Results" sections of this article. The cyan and magenta traces in this graph are the noise floor of perfect CD data, dithered at the 1/2-LSB level, which is as good as CD can get.
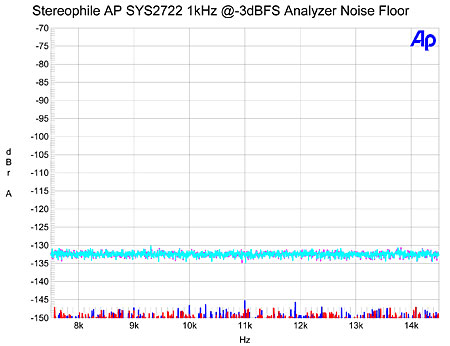
Fig.3 Noise floor of Audio Precision SYS2722 spectrum analyzer A/D converter; cyan and magenta traces show noise floor of perfectly dithered 16-bit data.
Since December 2007, I have been using both the Miller Jitter Analyzer and the Audio Precision SYS2722 to examine digital products' rejection of jitter. In this first article of a planned series of three, I gather together the SYS2722-derived measurements of disc-player jitter. (The remaining two articles will look at digital processors and transports.)
Strictly speaking, the J-Test is not diagnostic for products that do not embed the clock in the data. In well-designed CD players, for example, a separate clock signal carried on a printed-circuit-board trace separate from those that carry the audio data tells the D/A chip exactly when to convert the data word on its input to analog. Nevertheless, I have found that players vary enormously in their ability to handle the J-Test signal without problems, which is why I continue to use it with such products.
Why there should be problems with players is difficult to determine, but one culprit might be what Ed Meitner and Robert Gendron called "Logic-Induced Modulation" (LIM) They found that the audio encoded in a PCM stream being processed by logic gates was demodulated and appeared on the DC rail voltage of the circuit! This process gives rise to sidebands that resemble the effects of jitter in the ultimately converted analog signal. Their 1991 AES paper on LIM can be found here.
On to the results, which I have arranged as three groups: 1) disc players and media servers whose jitter susceptibility and self-noise are not good enough to reproduce CD data with full resolution; 2) products whose performance is good enough for full-resolution CD playback; and 3) players that can extract close to full resolution from high-resolution audio files from SACD and DVD-Audio discs (footnote 2). The models are listed in approximate order of increasing merit, and the prices listed are those at the time each review was first published or the sample was purchased.
The source for the measurements was 16-bit data encoded either on CD or as a WAV or FLAC file stored on a computer hard drive. The 0dB reference in all the graphs is the level at which each player reproduced a full-scale tone at 1kHz. The center frequency of each graph is 11kHz, with a horizontal frequency range of 7.5–14.5kHz.
Footnote 1: The test signal used to trigger the measurement was a 1kHz tone at an input level that produced digital data peaking at –3dBFS. Higher than that and the Audio Precision's autoranging circuit reduced the input gain, meaning that the SYS2722's A/D converter might well be up to 3dB quieter than the result plotted here.
Footnote 2: The assumption made here is that DVD-As and SACDs necessarily carry appropriately high-resolution audio data. Sadly, as we have reported in the past, that is not necessarily the case.
- Log in or register to post comments
