Sidebar 3: Measurements
To perform measurements on the Mark Levinson No.53 Reference, I used Stereophile's loan sample of the top-of-the-line Audio Precision SYS2722 system (see www.ap.com and the January 2008 "As We See It"). Before testing one of the monoblocks (serial no. 9800004396), I ran it at one-third its rated power into 8 ohms for 60 minutes, which thermally is the worst case for an amplifier with a class-A/B output stage. As the No.53 both uses a switching output stage and is very much more efficient at turning power from the wall into voltage and current to drive the loudspeaker, this test is not really applicable. Still, at the end of that period the vertical heatsinks on the amplifier's sides were warm, at 90.1°F (32.3°C). Peculiarly, the chassis was warmer than the heatsinks, at 97°F (36.1°C). After I'd run the amplifier for several hours at lower powers, the chassis and heatsinks had stabilized at around 110°F (43.3°C). This is due to the fact that, unlike a class-D amplifier, the switching transistors are continuously passing current. The THD+noise percentage at one-third power with the amplifier cold was a very low 0.0052%; this figure dropped to 0.00495% at the end of one hour.
The No.53's voltage gain into 8 ohms was the same for balanced and unbalanced operation: 26.8dB, as specified. Both modes preserved absolute polarity, the XLR input jack being wired with pin 2 hot. (Pin 3 was shorted to pin 1 with the supplied jumper for single-ended operation.) The balanced input impedance at low and middle frequencies was inconsequentially below the specified 100k ohms at 93k ohms, dropping to 64k ohms at 20kHz. The unbalanced input impedance was half those figures, as expected.
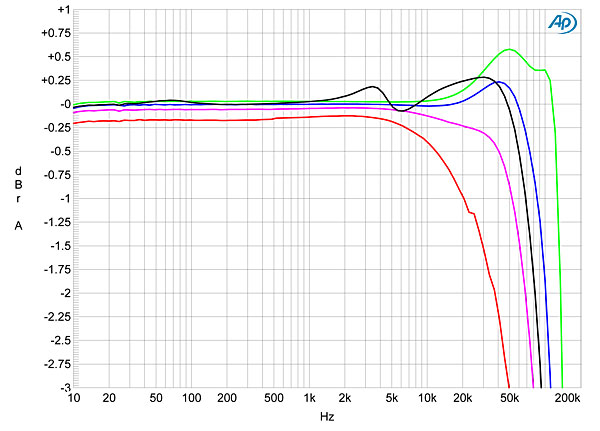
The output impedance at low frequencies was very low, at 0.06 ohm, including 6' of speaker cable. This rose to 0.25 ohm at the top of the audioband, presumably due to the presence of a passive output filter on the amplifier's output to reduce the level of ultrasonic switching noise. Not only did this increase in output impedance give rise to some modification of the amplifier's frequency response with our standard simulated loudspeaker (fig.1, gray trace; see www.stereophile.com/content/real-life-measurements-page-2), there was a degree of peaking above the audioband that developed with higher impedances (fig.1, blue and green traces). This peaking resulted in a single cycle of overshoot and well-damped ringing with an 8 ohm load (fig.2).

 Because ultrasonic and radio-frequency noise, even at low levels, can drive the Audio Precision analyzer's input into slew-rate limiting, which will produce distortion, all the following measurements of THD and IMD were taken with Audio Precision's AUX-0025 passive low-pass filter, which rejects noise above 200kHz and has a maximum input level of ±200V peak.
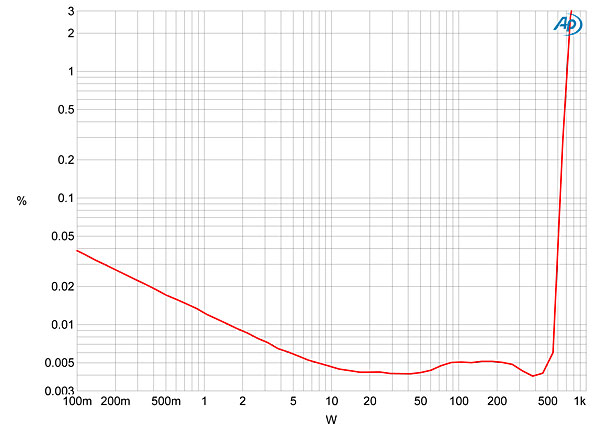
Figs. 4, 5, and 6 show how the THD+N percentage in the No.53's output varied with power into 8, 4, and 2 ohms, respectively. Below 10W into each load, the measurement is dominated by noise, indicated by the upward slope of the traces with decreasing power. The actual distortion starts to rise above the noise at a few tens of watts but is extremely low in level: at or below 0.005% into the higher impedances. Defining "clipping" as the power at which the amplifier was producing 1% of THD+N, the No.53 readily exceeds its specified output power, clipping at 686W into 8 ohms (28.4dBW), 1080W into 4 ohms (27.3dBW), and 1500W into 2 ohms (25.8dBW). (Note that I don't hold the wall voltage constant for these tests.)
Because ultrasonic and radio-frequency noise, even at low levels, can drive the Audio Precision analyzer's input into slew-rate limiting, which will produce distortion, all the following measurements of THD and IMD were taken with Audio Precision's AUX-0025 passive low-pass filter, which rejects noise above 200kHz and has a maximum input level of ±200V peak.
Figs. 4, 5, and 6 show how the THD+N percentage in the No.53's output varied with power into 8, 4, and 2 ohms, respectively. Below 10W into each load, the measurement is dominated by noise, indicated by the upward slope of the traces with decreasing power. The actual distortion starts to rise above the noise at a few tens of watts but is extremely low in level: at or below 0.005% into the higher impedances. Defining "clipping" as the power at which the amplifier was producing 1% of THD+N, the No.53 readily exceeds its specified output power, clipping at 686W into 8 ohms (28.4dBW), 1080W into 4 ohms (27.3dBW), and 1500W into 2 ohms (25.8dBW). (Note that I don't hold the wall voltage constant for these tests.)


 At low frequencies, the No.53's distortion spectrum was dominated by the subjectively innocuous third harmonic (fig.10), though "dominated" is not really the appropriate word to use for something lying at –106dB (0.0005%). This graph was taken into 8 ohms; reducing the load increased the level of the third harmonic by 10dB, with the second harmonic making an appearance just above –120dB (0.0001%, fig.11), but no higher-order harmonics present. However, with a 1kHz tone at the same level, a picket fence of harmonics appeared, both even- and odd-order (fig.12), which correlates with the bursts and spikes at the waveform's zero-crossing points. Again, while the levels of these harmonics are sufficiently low that it is unlikely they will be audible with music, this is still something I don't like to see.


 In almost all ways, the Mark Levinson Reference No.53 measures superbly well, especially for an amplifier with a switching output stage. But I keep returning to those bursts of noise and distortion at the signal's zero-crossing points. As I said, the absolute level of this behavior was very low. But it is a very unnatural thing to happen, and I can't help wondering if this behavior lay at the root of Michael Fremer's dissatisfaction with the No.53's sound. I took a listen to the Mark Levinsons driving Wilson Alexandria XLF speakers in his listening room. (Not only did I want to hear for myself if Michael was correct in his description of the No.53's character; as a longtime owner of a pair of the older Mark Levinson No.33H monoblocks, I was interested in hearing how the new amplifiers sounded.) The sound was initially very impressive. It had tremendous dynamic sweep, with superb control of the Wilsons' woofers, tremendous clarity, and nothing identifiably wrong. However, the more I listened, the more the overall sonic picture seemed flat and uninvolving. An enigma.—John Atkinson
Fig.1 Mark Levinson No.53 Reference, frequency response at 2.83V into: simulated loudspeaker load (gray), 16 ohms (green), 8 ohms (blue), 4 ohms (magenta), 2 ohms (red) (0.5dB/vertical div.).
Fig.2 Mark Levinson No.53 Reference, small-signal 10kHz squarewave into 8 ohms (no AP low-pass filter).
An amplifier with a switching output stage produces ultrasonic noise. However, with no signal, the No.53 had 7mV of noise with a center frequency of 197kHz present at its speaker terminals, which is significantly lower in level than with a conventional class-D amplifier. (The Anthem amplifier also reviewed this month, for example, has almost 900mV of ultrasonic noise present on its output.) The No.53's unweighted, wideband signal/noise ratio, ref. 1W into 8 ohms with the input shorted, was therefore still lower than usual, at just 52.1dB. Restricting the measurement bandwidth to the audioband increased the ratio to 87.3dB, while switching in an A-weighting filter increased it further, to 89.9dB. Fig.3 shows the spectrum at low frequencies of the Mark Levinson's noise floor while it drove a 1kHz signal at 150W into 8 ohms. Note the complete absence of AC-supply–related spuriae at 60Hz and its harmonics.
Fig.3 Mark Levinson No.53 Reference, spectrum of 1kHz sinewave, DC–1kHz, at 150W into 8 ohms (with AP low-pass filter, linear frequency scale).
Fig.4 Mark Levinson No.53 Reference, distortion (%) vs 1kHz continuous output power into 8 ohms (with AP low-pass filter).
Fig.5 Mark Levinson No.53 Reference, distortion (%) vs 1kHz continuous output power into 4 ohms (with AP low-pass filter).
Fig.6 Mark Levinson No.53 Reference, distortion (%) vs 1kHz continuous output power into 2 ohms (with AP low-pass filter).
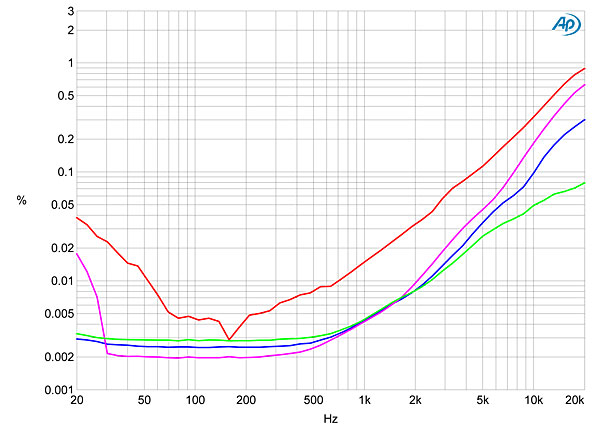
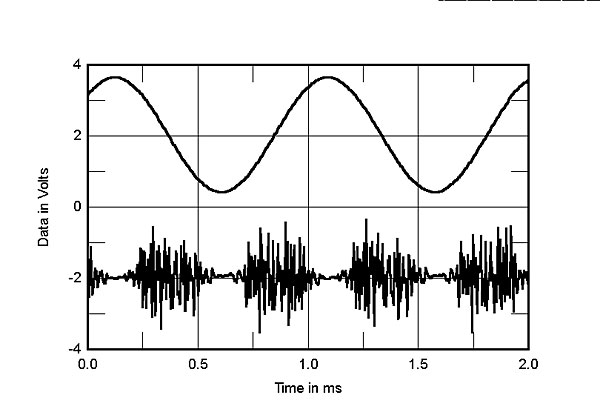
This amplifier is a powerhouse. However, plotting the THD+N percentage against frequency at a voltage where I could be sure that the measurement was showing actual distortion rather than noise—14.15V, equivalent to 25W into 8 ohms, 50W into 4 ohms, and 100W into 2 ohms—revealed that the THD rose considerably above 500Hz, particularly into lower impedances (fig.7). I wasn't expecting this, as one supposed benefit of Mark Levinson's proprietary "class-I" output-stage topology is improved high-frequency linearity compared with conventional class-D designs. I also wasn't expecting what I found when I examined the waveform of the No.53's residual distortion: a burst of high-frequency noise at every zero-crossing point (fig.8). Into lower impedances, these bursts of noise were accompanied by voltage spikes, alternately positive- and negative-going, at the exact zero-voltage points (fig.9). Note that while the actual THD+N percentage was very low, at 0.005%, this kind of behavior might be more audible than the low percentage would suggest.
Fig.7 Mark Levinson No.53 Reference, THD+N (%) vs frequency (with AP low-pass filter) at 14.15V into: 16 ohms (green), 8 ohms (blue), 4 ohms (magenta), 2 ohms (red).
Fig.8 Mark Levinson No.53 Reference, 1kHz waveform at 173W into 8 ohms (with AP low-pass filter), 0.005% THD+N (top); distortion and noise waveform with fundamental notched out (bottom, not to scale).
Fig.9 Mark Levinson No.53 Reference, 1kHz waveform at 340W into 4 ohms (with AP low-pass filter), 0.005% THD+N (top); distortion and noise waveform with fundamental notched out (bottom, not to scale).
Fig.10 Mark Levinson No.53 Reference, spectrum of 50Hz sinewave, DC–1kHz, at 150W into 8 ohms (with AP low-pass filter, linear frequency scale).
Fig.11 Mark Levinson No.53 Reference, spectrum of 50Hz sinewave, DC–1kHz, at 300W into 4 ohms (with AP low-pass filter, linear frequency scale).
Fig.12 Mark Levinson No.53 Reference, spectrum of 1kHz sinewave, DC–10kHz, at 150W into 8 ohms (with AP low-pass filter, linear frequency scale).
Surprisingly, despite the amplifier's reduced linearity at the top of the audioband, it performed well on the punishing high-frequency intermodulation test (fig.13). The difference product resulting from the equal mix of 19 and 20kHz tones lay at –114dB (0.0002%), and the higher-order intermodulation products all lay at or below –83dB (0.007%).
Fig.13 Mark Levinson No.53 Reference, HF intermodulation spectrum, DC–24kHz, 19+20kHz at 300W peak into 4 ohms (with AP low-pass filter, linear frequency scale).