The impedance measurement is a major diagnostic tool. It is possible to find out a lot about how a loudspeaker is going to behave just from looking at its electrical impedance. Without even seeing the speaker, the number of "ways" will almost always be apparent from the impedance plot, as will whether it is a sealed-box design (one hump in the bass), a reflex or a transmission line (two humps in the bass), or a horn of some kind (a series of regularly spaced peaks). The approximate low-frequency extension will be apparent from the shape of the plots in the bass, as will its Q. The "saddle" between the twin low-frequency impedance peaks typical of a reflex design indicates the tuning of the port, which is generally the bass frequency where the loudspeaker's response has dropped by 6dB, approximately half the reference loudness. You can also find out whether there are resonances present in the system and what kind they are. For example, if you perform the measurement with sufficient frequency resolution, small glitches appear in the plots due to cabinet resonances of various kinds [24]. Those present at 200Hz and 450Hz in fig.2 are due to cabinet vibrational modes, for example, while the glitch at 27kHz is due to the tweeter's first dome or "oil-can" resonance, where the central region of the dome is moving in the opposite direction to the surrounding annulus. Fig.5 shows the impedance magnitude and phase for a different model where the designer decided he would throw out all the damping inside the cabinet because to him it made it sound better. Well, it probably made the speaker sound more "exciting," but there were both major air-space resonances and panel resonances present all through the midrange; predictably, they showed up strongly in the speaker's impedance plot as easily visible glitches. Before I had even auditioned the speaker, I could predict from fig.5 that it would have severe midrange coloration problems. The reviewer (Tom Norton) had already noted these problems in his auditioning well before he had seen this measurement.
 Fig.5 Loudspeaker with undamped cabinet panels, measured electrical impedance magnitude (solid trace) and phase (dashed trace) plotted against frequency in Hz. Perhaps most important, you can predict from its impedance plot how hard the loudspeaker is for an amplifier to drive. Because a loudspeaker's impedance is reactive, the current will lag or lead the signal voltage by the phase angle [25]. In the worst case—when the phase angle is 90 degrees—the amplifier is required to source the maximum current at the same time as the signal voltage approaches zero. Simply to specify a loudspeaker as having an 8 ohm nominal impedance, therefore, can be misleading. Depending on the phase angle of the impedance, which will be different at every frequency, the loudspeaker could look to the amplifier as having a much lower impedance. However, as the late Peter Baxandall pointed out in an Audio Engineering Society presentation in 1987 [26], the maximum phase angle never occurs when the impedance has its lowest amplitude. As both are two-dimensional projections of a three-dimensional phenomenon, they're mathematically related. There has been much conjecture on this subject for the past 20 years in audiophile circles. Eric Benjamin of Dolby examined the matter in detail in 1992 [27]. (The "References" section of his paper is comprehensive.) In particular, he looked at the theoretical power dissipation in an amplifier's class-B output stage, which will depend on the speaker impedance magnitude and phase angle. While he found that the maximum current drawn by a loudspeaker almost never exceeds that predicted by the minimum impedance value, the calculated dissipation in the amplifier output devices was between 120% and 270% of that predicted, depending on the impedance and the drive signal.
It appears, therefore, that amplifier output stages need to be overspecified from slightly to considerably, depending on the loudspeakers they are required to drive. That most amplifiers don't appear to be significantly stressed is due to the fact that, as E. Brad Meyer has pointed out [28], at typical listening levels in a typical room with typical loudspeakers, a consumer amplifier is never required to deliver more than a few watts. Nevertheless, a speaker's impedance behavior can have a primary effect on its sound quality. Figs.6 & 7, for example, show two of the lowest-impedance loudspeakers that I have measured, yet their impedance curves vary significantly, particularly regarding phase angle. Fig.6 shows a speaker that remains above 5 ohms below 2kHz, but plunges to 1 ohm above 12kHz, with an amplifier-crushing combination of 2.4 ohms and -70 degrees at 3.3kHz. By contrast, fig.7 shows a loudspeaker that has an amplitude of 3 ohms or below over almost all the band, yet the phase angle is benign. It is not easy to predict just from looking at these graphs which would be the harder speaker for an amplifier to drive. A future Stereophile project is to calculate Benjamin's "peak drive difficulty" data for the loudspeakers I have measured for the magazine in order to develop an index figure that can be quoted in reviews.
Fig.5 Loudspeaker with undamped cabinet panels, measured electrical impedance magnitude (solid trace) and phase (dashed trace) plotted against frequency in Hz. Perhaps most important, you can predict from its impedance plot how hard the loudspeaker is for an amplifier to drive. Because a loudspeaker's impedance is reactive, the current will lag or lead the signal voltage by the phase angle [25]. In the worst case—when the phase angle is 90 degrees—the amplifier is required to source the maximum current at the same time as the signal voltage approaches zero. Simply to specify a loudspeaker as having an 8 ohm nominal impedance, therefore, can be misleading. Depending on the phase angle of the impedance, which will be different at every frequency, the loudspeaker could look to the amplifier as having a much lower impedance. However, as the late Peter Baxandall pointed out in an Audio Engineering Society presentation in 1987 [26], the maximum phase angle never occurs when the impedance has its lowest amplitude. As both are two-dimensional projections of a three-dimensional phenomenon, they're mathematically related. There has been much conjecture on this subject for the past 20 years in audiophile circles. Eric Benjamin of Dolby examined the matter in detail in 1992 [27]. (The "References" section of his paper is comprehensive.) In particular, he looked at the theoretical power dissipation in an amplifier's class-B output stage, which will depend on the speaker impedance magnitude and phase angle. While he found that the maximum current drawn by a loudspeaker almost never exceeds that predicted by the minimum impedance value, the calculated dissipation in the amplifier output devices was between 120% and 270% of that predicted, depending on the impedance and the drive signal.
It appears, therefore, that amplifier output stages need to be overspecified from slightly to considerably, depending on the loudspeakers they are required to drive. That most amplifiers don't appear to be significantly stressed is due to the fact that, as E. Brad Meyer has pointed out [28], at typical listening levels in a typical room with typical loudspeakers, a consumer amplifier is never required to deliver more than a few watts. Nevertheless, a speaker's impedance behavior can have a primary effect on its sound quality. Figs.6 & 7, for example, show two of the lowest-impedance loudspeakers that I have measured, yet their impedance curves vary significantly, particularly regarding phase angle. Fig.6 shows a speaker that remains above 5 ohms below 2kHz, but plunges to 1 ohm above 12kHz, with an amplifier-crushing combination of 2.4 ohms and -70 degrees at 3.3kHz. By contrast, fig.7 shows a loudspeaker that has an amplitude of 3 ohms or below over almost all the band, yet the phase angle is benign. It is not easy to predict just from looking at these graphs which would be the harder speaker for an amplifier to drive. A future Stereophile project is to calculate Benjamin's "peak drive difficulty" data for the loudspeakers I have measured for the magazine in order to develop an index figure that can be quoted in reviews.  Fig.6 Bad amplifier load 1, measured electrical impedance magnitude (solid trace) and phase (dashed trace) plotted against frequency in Hz.
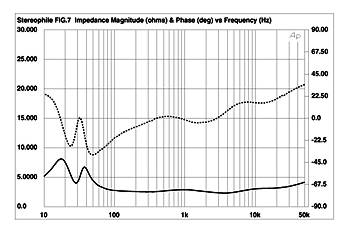 Fig.7 Bad amplifier load 2, measured electrical impedance magnitude (solid trace) and phase (dashed trace) plotted against frequency in Hz. Part 2 of this article examines the concepts of a loudspeaker's time-domain behavior and nonlinear distortions of all kinds. Part 3 will examine all the various types of frequency response.
Fig.5 Loudspeaker with undamped cabinet panels, measured electrical impedance magnitude (solid trace) and phase (dashed trace) plotted against frequency in Hz. Perhaps most important, you can predict from its impedance plot how hard the loudspeaker is for an amplifier to drive. Because a loudspeaker's impedance is reactive, the current will lag or lead the signal voltage by the phase angle [25]. In the worst case—when the phase angle is 90 degrees—the amplifier is required to source the maximum current at the same time as the signal voltage approaches zero. Simply to specify a loudspeaker as having an 8 ohm nominal impedance, therefore, can be misleading. Depending on the phase angle of the impedance, which will be different at every frequency, the loudspeaker could look to the amplifier as having a much lower impedance. However, as the late Peter Baxandall pointed out in an Audio Engineering Society presentation in 1987 [26], the maximum phase angle never occurs when the impedance has its lowest amplitude. As both are two-dimensional projections of a three-dimensional phenomenon, they're mathematically related. There has been much conjecture on this subject for the past 20 years in audiophile circles. Eric Benjamin of Dolby examined the matter in detail in 1992 [27]. (The "References" section of his paper is comprehensive.) In particular, he looked at the theoretical power dissipation in an amplifier's class-B output stage, which will depend on the speaker impedance magnitude and phase angle. While he found that the maximum current drawn by a loudspeaker almost never exceeds that predicted by the minimum impedance value, the calculated dissipation in the amplifier output devices was between 120% and 270% of that predicted, depending on the impedance and the drive signal. Fig.6 Bad amplifier load 1, measured electrical impedance magnitude (solid trace) and phase (dashed trace) plotted against frequency in Hz. Fig.7 Bad amplifier load 2, measured electrical impedance magnitude (solid trace) and phase (dashed trace) plotted against frequency in Hz. Part 2 of this article examines the concepts of a loudspeaker's time-domain behavior and nonlinear distortions of all kinds. Part 3 will examine all the various types of frequency response.