Sidebar 3: Measurements
I used DRA Labs' MLSSA system and a calibrated DPA 4006 microphone to measure the Harbeth's frequency response in the farfield, and an Earthworks QTC-40 for the nearfield and spatially averaged room responses. Harbeth specifies the P3ESR as having a sensitivity of 83.5dB/W/m. My estimate was slightly less than this, at 83dB(B)/2.83V/m, but this is within experimental error of the specification. This is a significantly lower sensitivity than the norm, meaning that the little Harbeth will need a fairly powerful amplifier to play at acceptable levels in all but small rooms. However, its limited power handling (50W program) places a strict upper limit on the loudness it will produce. The Harbeth is claimed to be "easy to drive," and indeed, its plot of impedance magnitude and phase revealed that to be the case (fig.1). It is also an easier amplifier load than its predecessor, the HL-P3ES2. Other than a dip to 5.7 ohms at the bottom of the midrange, the P3ESR's impedance remains above 8 ohms for almost the entire audioband, which will make it a good choice for use with tube amplifiers, provided they can swing enough volts to drive it to high enough levels. However, the shape of the impedance curve suggests that the balance will tilt up a little at the high end with such an amplifier.
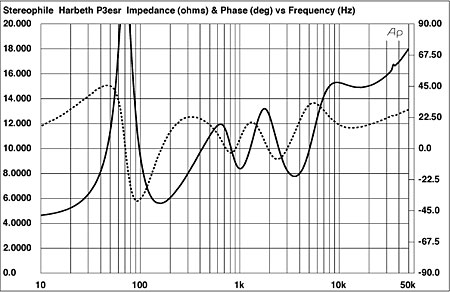 Fig.1 Harbeth P3ESR, electrical impedance (solid) and phase (dashed). (2 ohms/vertical div.)
Earlier generations of the HL-P3 had quite lively cabinets, with significant resonant modes present between 300 and 400Hz. By contrast, the P3ESR's enclosure was better behaved; the strongest mode I could find was at a beneficially high 516Hz on the top panel (fig.2). (All else being equal, the higher in frequency a cabinet resonance, the less it will affect a speaker's sound quality.) And while there were modes present on all surfaces at 320 and 410Hz, these were all relatively low in level. I could hear these modes with a stethoscope when I played the half-step–spaced toneburst track from Editor's Choice (CD, Stereophile STPH016-2), but with regular music listening, I could not identify any coloration that might be due to this behavior.
Fig.1 Harbeth P3ESR, electrical impedance (solid) and phase (dashed). (2 ohms/vertical div.)
Earlier generations of the HL-P3 had quite lively cabinets, with significant resonant modes present between 300 and 400Hz. By contrast, the P3ESR's enclosure was better behaved; the strongest mode I could find was at a beneficially high 516Hz on the top panel (fig.2). (All else being equal, the higher in frequency a cabinet resonance, the less it will affect a speaker's sound quality.) And while there were modes present on all surfaces at 320 and 410Hz, these were all relatively low in level. I could hear these modes with a stethoscope when I played the half-step–spaced toneburst track from Editor's Choice (CD, Stereophile STPH016-2), but with regular music listening, I could not identify any coloration that might be due to this behavior.
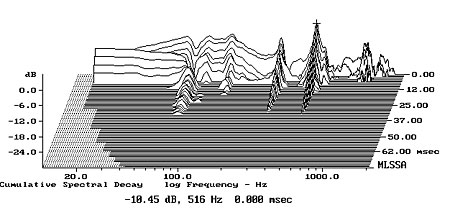 Fig.2 Harbeth P3ESR, cumulative spectral-decay plot calculated from output of accelerometer fastened to center of top panel (MLS driving voltage to speaker, 7.55V; measurement bandwidth, 2kHz).
Harbeth recommends that the P3ESR be used with its grille in place. As I say in my "Listening" comments, I tried it both ways, ultimately preferring the sound without the grille. Fig.3 shows the response without the grille on the Harbeth's tweeter axis, averaged across a 30° horizontal window. The tweeter appears to be a couple of dB too high in level, but other than that, the P3ESR's balance is superbly even. The rise in the upper bass will be, as usual, due to the nearfield measurement assuming a 2pi environment; without that bump, the speaker's low frequencies will be down by 6dB at the woofer's tuning frequency of 70Hz. This is definitely a miniature speaker, but the upper bass isn't exaggerated to anywhere near the extent it was in the original BBC LS3/5A. Fig.4 shows the effect of the grille on the response shown in fig.3. The small peak between 4 and 5kHz is pulled down a little, as is the speaker's output in the top octave, but the mid-treble balance is smoother overall with the grille.
Fig.2 Harbeth P3ESR, cumulative spectral-decay plot calculated from output of accelerometer fastened to center of top panel (MLS driving voltage to speaker, 7.55V; measurement bandwidth, 2kHz).
Harbeth recommends that the P3ESR be used with its grille in place. As I say in my "Listening" comments, I tried it both ways, ultimately preferring the sound without the grille. Fig.3 shows the response without the grille on the Harbeth's tweeter axis, averaged across a 30° horizontal window. The tweeter appears to be a couple of dB too high in level, but other than that, the P3ESR's balance is superbly even. The rise in the upper bass will be, as usual, due to the nearfield measurement assuming a 2pi environment; without that bump, the speaker's low frequencies will be down by 6dB at the woofer's tuning frequency of 70Hz. This is definitely a miniature speaker, but the upper bass isn't exaggerated to anywhere near the extent it was in the original BBC LS3/5A. Fig.4 shows the effect of the grille on the response shown in fig.3. The small peak between 4 and 5kHz is pulled down a little, as is the speaker's output in the top octave, but the mid-treble balance is smoother overall with the grille.
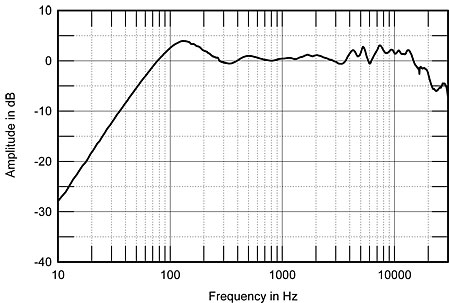 Fig.3 Harbeth P3ESR, anechoic response on tweeter axis at 50" without grille, averaged across 30° horizontal window and corrected for microphone response, with nearfield woofer response plotted below 300Hz.
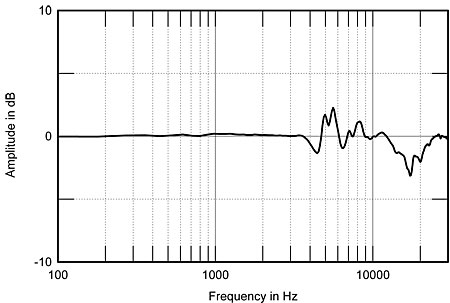 Fig.4 Harbeth P3ESR, difference in tweeter-axis response made by grille (5dB/vertical div.).
The Harbeth's lateral dispersion, taken without the grille and normalized to the response on the tweeter axis, is shown in fig.5. As expected from the narrow baffle and small woofer diameter, the radiation pattern is wide and even through the midrange and low treble. The apparent off-axis peakiness in the mid-treble is due in part to dips in the on-axis response filling in to the speaker's sides. The tweeter becomes more directional in the top audio octave than is usual for a 19mm unit. In the vertical plane, the radiation pattern, again normalized to the tweeter-axis response (fig.6), indicates that it is important to use stands high enough that the tweeter is at or just below the level of the listener's ears; if the ears are any lower, a large suckout develops in the crossover region.
Fig.4 Harbeth P3ESR, difference in tweeter-axis response made by grille (5dB/vertical div.).
The Harbeth's lateral dispersion, taken without the grille and normalized to the response on the tweeter axis, is shown in fig.5. As expected from the narrow baffle and small woofer diameter, the radiation pattern is wide and even through the midrange and low treble. The apparent off-axis peakiness in the mid-treble is due in part to dips in the on-axis response filling in to the speaker's sides. The tweeter becomes more directional in the top audio octave than is usual for a 19mm unit. In the vertical plane, the radiation pattern, again normalized to the tweeter-axis response (fig.6), indicates that it is important to use stands high enough that the tweeter is at or just below the level of the listener's ears; if the ears are any lower, a large suckout develops in the crossover region.
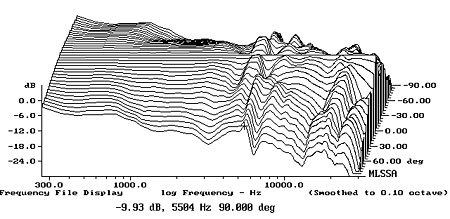 Fig.5 Harbeth P3ESR, lateral response family at 50", normalized to response on tweeter axis, from back to front: differences in response 90–5° off axis, reference response, differences in response 5–90° off axis.
 Fig.6 Harbeth P3ESR, vertical response family at 50", normalized to response on tweeter axis, from back to front: differences in response 45–5° above axis, reference response, differences in response 5–45° below axis.
Looking at the P3ESR's spatially averaged in-room response at the listening position (fig.7, red trace), there were only minor differences between its behavior and that of the 2007 sample of the HL-P3-ES2 (blue trace). Both the midrange and treble are very smooth, though the new model's high treble is a dB or so hotter than the earlier one's, as suggested by the quasi-anechoic response seen in fig.3.
Fig.6 Harbeth P3ESR, vertical response family at 50", normalized to response on tweeter axis, from back to front: differences in response 45–5° above axis, reference response, differences in response 5–45° below axis.
Looking at the P3ESR's spatially averaged in-room response at the listening position (fig.7, red trace), there were only minor differences between its behavior and that of the 2007 sample of the HL-P3-ES2 (blue trace). Both the midrange and treble are very smooth, though the new model's high treble is a dB or so hotter than the earlier one's, as suggested by the quasi-anechoic response seen in fig.3.
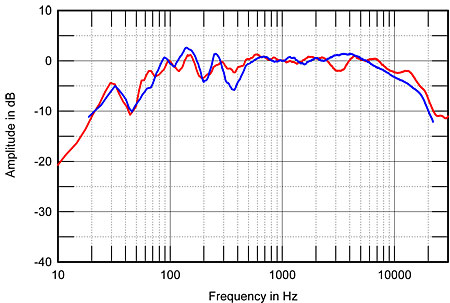 Fig.7 Harbeth P3ESR, spatially averaged, 1/6-octave response in JA's listening room (red) and of HL-P3ES2 (blue).
Turning to the time domain, the Harbeth's step response on the tweeter axis (fig.8) indicates that the tweeter is connected in negative acoustic polarity, the woofer in positive. The tweeter's output arrives at the microphone earlier than the woofer's, with the rise of the woofer's step arriving a little too late to blend with the positive-going overshoot of the tweeter's step. While on this axis the drive-units do integrate well in the frequency domain, this behavior might correlate with the need to audition this speaker on or close to the tweeter axis to get the optimal balance. Some slight high-frequency ripples can be seen in the decay of the woofer's step; the cumulative spectral-decay plot (fig.9) indicates that these are associated with some delayed energy between 4 and 5kHz. Even so, this plot shows a somewhat cleaner decay in this region than that of the HLP3-ES2 (see fig.8 here), which I assume is due to the change to the Radial2 cone material.—John Atkinson
Fig.7 Harbeth P3ESR, spatially averaged, 1/6-octave response in JA's listening room (red) and of HL-P3ES2 (blue).
Turning to the time domain, the Harbeth's step response on the tweeter axis (fig.8) indicates that the tweeter is connected in negative acoustic polarity, the woofer in positive. The tweeter's output arrives at the microphone earlier than the woofer's, with the rise of the woofer's step arriving a little too late to blend with the positive-going overshoot of the tweeter's step. While on this axis the drive-units do integrate well in the frequency domain, this behavior might correlate with the need to audition this speaker on or close to the tweeter axis to get the optimal balance. Some slight high-frequency ripples can be seen in the decay of the woofer's step; the cumulative spectral-decay plot (fig.9) indicates that these are associated with some delayed energy between 4 and 5kHz. Even so, this plot shows a somewhat cleaner decay in this region than that of the HLP3-ES2 (see fig.8 here), which I assume is due to the change to the Radial2 cone material.—John Atkinson
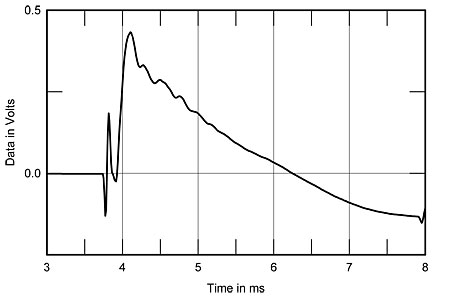 Fig.8 Harbeth P3ESR, step response on tweeter axis at 50" (5ms time window, 30kHz bandwidth).
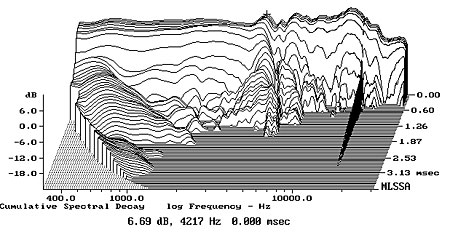 Fig.9 Harbeth P3ESR, cumulative spectral-decay plot on tweeter axis at 50" (0.15ms risetime).
Fig.1 Harbeth P3ESR, electrical impedance (solid) and phase (dashed). (2 ohms/vertical div.)
Earlier generations of the HL-P3 had quite lively cabinets, with significant resonant modes present between 300 and 400Hz. By contrast, the P3ESR's enclosure was better behaved; the strongest mode I could find was at a beneficially high 516Hz on the top panel (fig.2). (All else being equal, the higher in frequency a cabinet resonance, the less it will affect a speaker's sound quality.) And while there were modes present on all surfaces at 320 and 410Hz, these were all relatively low in level. I could hear these modes with a stethoscope when I played the half-step–spaced toneburst track from Editor's Choice (CD, Stereophile STPH016-2), but with regular music listening, I could not identify any coloration that might be due to this behavior.
Fig.2 Harbeth P3ESR, cumulative spectral-decay plot calculated from output of accelerometer fastened to center of top panel (MLS driving voltage to speaker, 7.55V; measurement bandwidth, 2kHz).
Fig.3 Harbeth P3ESR, anechoic response on tweeter axis at 50" without grille, averaged across 30° horizontal window and corrected for microphone response, with nearfield woofer response plotted below 300Hz.
Fig.4 Harbeth P3ESR, difference in tweeter-axis response made by grille (5dB/vertical div.).
The Harbeth's lateral dispersion, taken without the grille and normalized to the response on the tweeter axis, is shown in fig.5. As expected from the narrow baffle and small woofer diameter, the radiation pattern is wide and even through the midrange and low treble. The apparent off-axis peakiness in the mid-treble is due in part to dips in the on-axis response filling in to the speaker's sides. The tweeter becomes more directional in the top audio octave than is usual for a 19mm unit. In the vertical plane, the radiation pattern, again normalized to the tweeter-axis response (fig.6), indicates that it is important to use stands high enough that the tweeter is at or just below the level of the listener's ears; if the ears are any lower, a large suckout develops in the crossover region.
Fig.5 Harbeth P3ESR, lateral response family at 50", normalized to response on tweeter axis, from back to front: differences in response 90–5° off axis, reference response, differences in response 5–90° off axis.
Fig.6 Harbeth P3ESR, vertical response family at 50", normalized to response on tweeter axis, from back to front: differences in response 45–5° above axis, reference response, differences in response 5–45° below axis.
Looking at the P3ESR's spatially averaged in-room response at the listening position (fig.7, red trace), there were only minor differences between its behavior and that of the 2007 sample of the HL-P3-ES2 (blue trace). Both the midrange and treble are very smooth, though the new model's high treble is a dB or so hotter than the earlier one's, as suggested by the quasi-anechoic response seen in fig.3.
Fig.7 Harbeth P3ESR, spatially averaged, 1/6-octave response in JA's listening room (red) and of HL-P3ES2 (blue).
Turning to the time domain, the Harbeth's step response on the tweeter axis (fig.8) indicates that the tweeter is connected in negative acoustic polarity, the woofer in positive. The tweeter's output arrives at the microphone earlier than the woofer's, with the rise of the woofer's step arriving a little too late to blend with the positive-going overshoot of the tweeter's step. While on this axis the drive-units do integrate well in the frequency domain, this behavior might correlate with the need to audition this speaker on or close to the tweeter axis to get the optimal balance. Some slight high-frequency ripples can be seen in the decay of the woofer's step; the cumulative spectral-decay plot (fig.9) indicates that these are associated with some delayed energy between 4 and 5kHz. Even so, this plot shows a somewhat cleaner decay in this region than that of the HLP3-ES2 (see fig.8 here), which I assume is due to the change to the Radial2 cone material.—John Atkinson
Fig.8 Harbeth P3ESR, step response on tweeter axis at 50" (5ms time window, 30kHz bandwidth).
Fig.9 Harbeth P3ESR, cumulative spectral-decay plot on tweeter axis at 50" (0.15ms risetime).