Sidebar 3: Measurements
I performed a full set of measurements on the Cary SI-300.2d using my Audio Precision SYS2722 system (see the January 2008 "As We See It"). Usually, I precondition an amplifier by running it with both channels driven at one-third power into 8 ohms for 60 minutes. After just 20 minutes, however, the temperature of the Cary's internal heatsink, which can be touched, was 192.8°F (89.3°C); that of the top panel, just behind the faceplate, was 120.6°F (49.3°C). After another 20 minutes, the SI-300.2d turned off its outputs, and "PROTECT" appeared on its display. I let the amplifier cool down, then turned it back on and continued testing. But the Cary's heatsinking is smaller than it theoretically needs to be for an amplifier capable of delivering 300Wpc into 8 ohms.
Looking first at the performance of the SI-300.2d via its analog inputs: The volume control operated in accurate 1dB steps, and the voltage gain into 8 ohms with the volume control set to its maximum measured 30.7dB for both balanced and unbalanced input signals, this increasing by 4dB rather than the specified 6dB when I pressed the Mode button on the remote control. The preamplifier outputs appeared to be just under unity gain, sourced from a highish 895 ohms. The unbalanced inputs were non-inverting, but the balanced inputs appeared to be wired with pin 3 rather than pin 2 hot, as they inverted absolute polarity. The unbalanced input impedance across the audioband was 23k ohms, the balanced impedance twice that value, as expected.
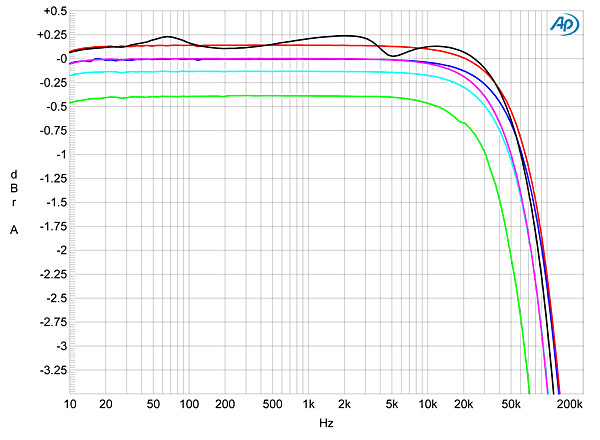
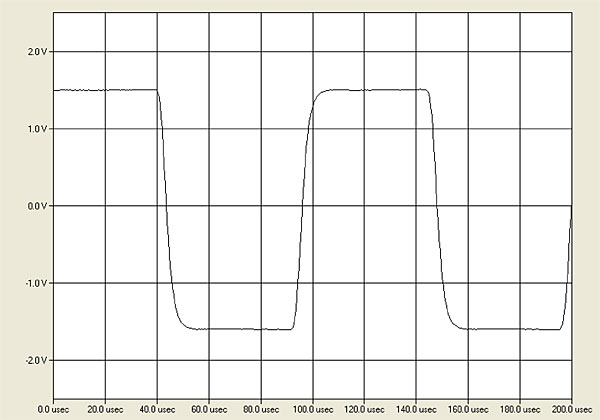
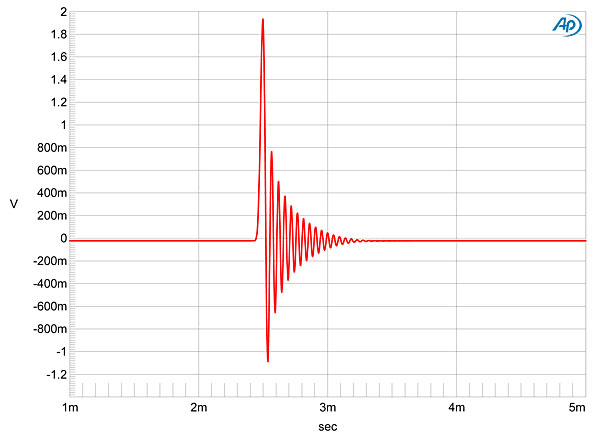
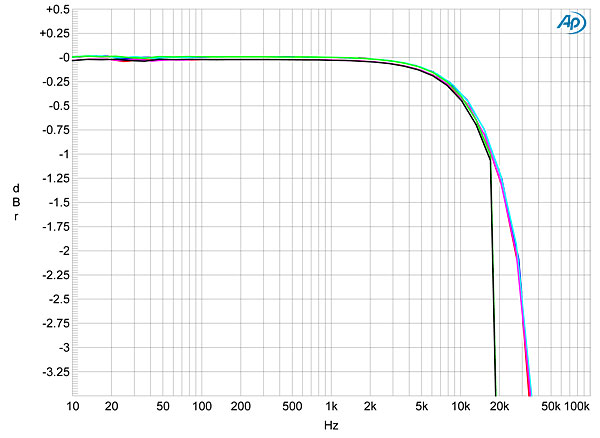
The Cary's output impedance (including 10' of speaker cable) was 0.13 ohm at 20Hz and 1kHz, rising slightly to 0.18 ohm at 20kHz. The modulation of the amplifier's frequency response into our standard simulated loudspeaker was fairly low, at ±0.1dB (fig.1, gray trace). This graph was taken with the volume control set to its maximum of "60"; there was no difference in the performance with the control set to "40," and as the Cary's response was down by 3dB at 110kHz, its reproduction of a 10kHz squarewave was excellent, with relatively short risetimes (fig.2).
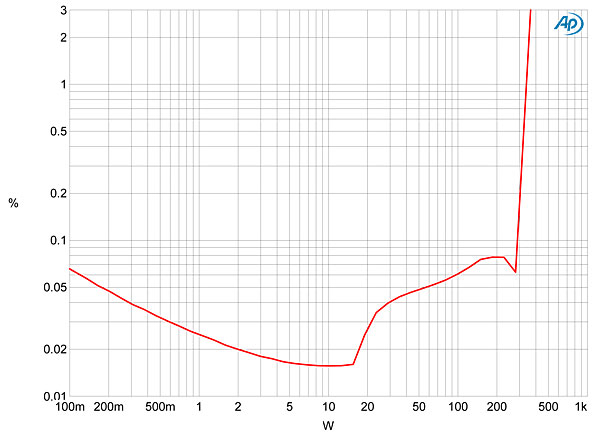
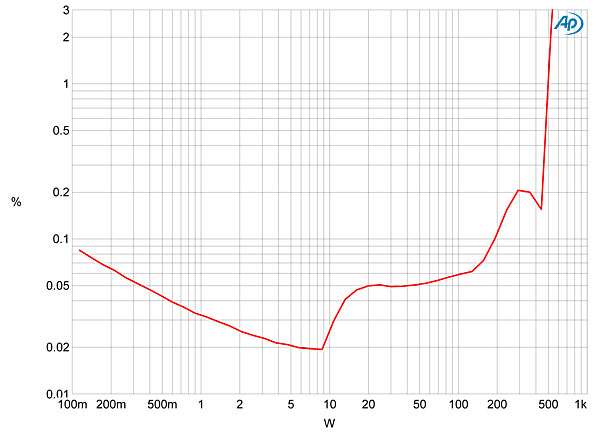
 Cary's SI-300.2d exceeded its specified maximum power of 300Wpc into 8 ohms (24.8dBW), clipping (defined as 1% THD+noise) at 337W with both channels driven into 8 ohms (25.3dBW, fig.4). The specified maximum power into 4 ohms is 450Wpc (23.5dBW) but the measured clipping power into this load was 500Wpc (24dBW, fig.5). I didn't test the clipping power into 2 ohms, as a burst of ultrasonic noise appeared on the tops and bottoms of the waveform at high powers into this load, and I was concerned about breaking the amplifier.
 Turning to the SI-300.2d's digital inputs, a 1kHz tone at 0dBFS resulted in a level from the preamplifier output of 1.873V with the volume control set to its maximum, and 57.95V from the speaker outputs into 8 ohms. However, as the power amplifier was clipping slightly at this level, it appears that the digital inputs' gain architecture is close to optimal. As the Cary's speaker outputs can't be turned off, I reduced the volume control by 10dB for the rest of the digital-input testing, and disconnected the test load from the speaker outputs to avoid damaging the amplifier with full-scale digital signals. All of the digital test results refer to the signal at the Cary's preamplifier output.
As well as the Audio Precision's digital outputs, I used WAV and AIFF test-tone files sourced via USB from Pure Music 3.0 on my MacBook Pro computer running on battery power. Apple's USB Prober utility identified the Cary as "xCORE USB Audio 2.0" from "XMOS," and revealed that its USB port operated in the optimal isochronous asynchronous mode. Apple's AudioMIDI utility showed that, via USB, the SI-300.2d accepted 24-bit integer data sampled at all rates from 44.1 to 384kHz.
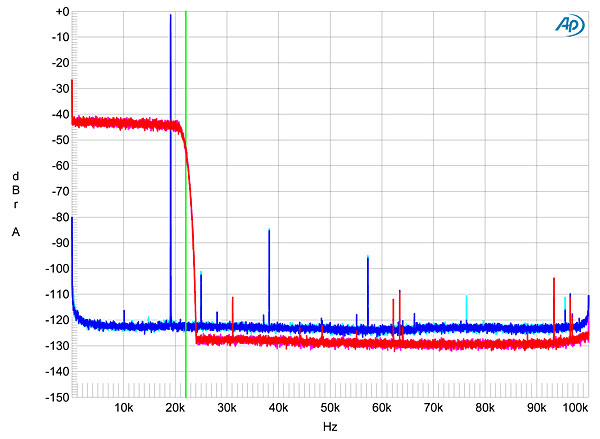
The Cary offers a wide range of upsampling options, but not with USB data, which is what I use to examine a DAC's impulse response and wideband spectral analyses. (This is because while the test signals are sampled at 44.1kHz, the Audio Precision's digital generator needs to be set to 200kHz to provide a measurement bandwidth of 100kHz.) The SI-300.2d's impulse response with 44.1kHz data (fig.10) reveals the reconstruction filter to be a minimum-phase type. Wideband spectral analysis with 44.1kHz white noise at –4dBFS (fig.11, magenta and red traces) shows this filter to have the expected sharp cutoff above 20kHz, and the distortion harmonics of a full-scale tone at 19.1kHz (cyan, blue) are all low in level.
Turning to the SI-300.2d's digital inputs, a 1kHz tone at 0dBFS resulted in a level from the preamplifier output of 1.873V with the volume control set to its maximum, and 57.95V from the speaker outputs into 8 ohms. However, as the power amplifier was clipping slightly at this level, it appears that the digital inputs' gain architecture is close to optimal. As the Cary's speaker outputs can't be turned off, I reduced the volume control by 10dB for the rest of the digital-input testing, and disconnected the test load from the speaker outputs to avoid damaging the amplifier with full-scale digital signals. All of the digital test results refer to the signal at the Cary's preamplifier output.
As well as the Audio Precision's digital outputs, I used WAV and AIFF test-tone files sourced via USB from Pure Music 3.0 on my MacBook Pro computer running on battery power. Apple's USB Prober utility identified the Cary as "xCORE USB Audio 2.0" from "XMOS," and revealed that its USB port operated in the optimal isochronous asynchronous mode. Apple's AudioMIDI utility showed that, via USB, the SI-300.2d accepted 24-bit integer data sampled at all rates from 44.1 to 384kHz.
The Cary offers a wide range of upsampling options, but not with USB data, which is what I use to examine a DAC's impulse response and wideband spectral analyses. (This is because while the test signals are sampled at 44.1kHz, the Audio Precision's digital generator needs to be set to 200kHz to provide a measurement bandwidth of 100kHz.) The SI-300.2d's impulse response with 44.1kHz data (fig.10) reveals the reconstruction filter to be a minimum-phase type. Wideband spectral analysis with 44.1kHz white noise at –4dBFS (fig.11, magenta and red traces) shows this filter to have the expected sharp cutoff above 20kHz, and the distortion harmonics of a full-scale tone at 19.1kHz (cyan, blue) are all low in level.
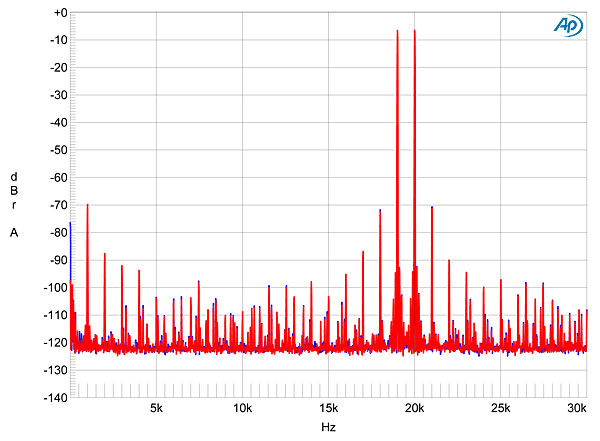
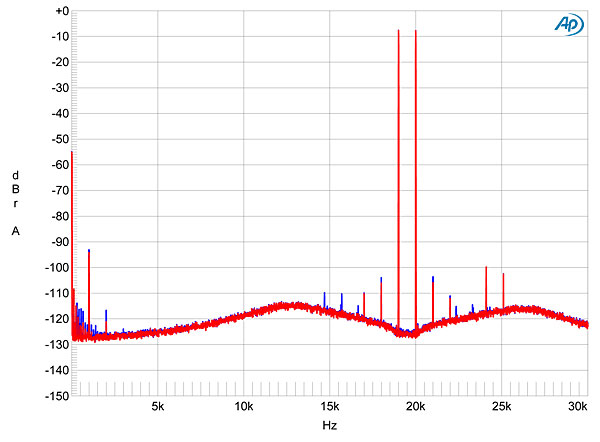
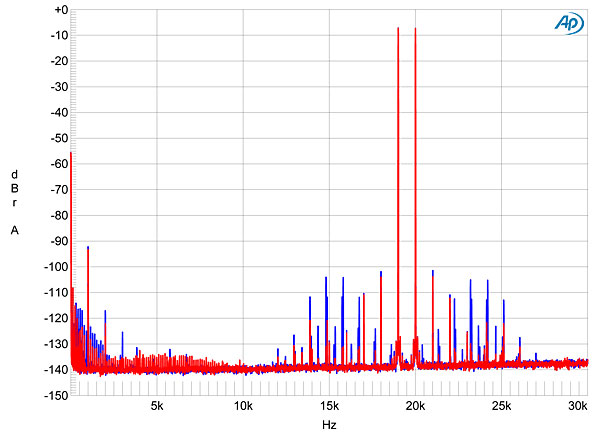
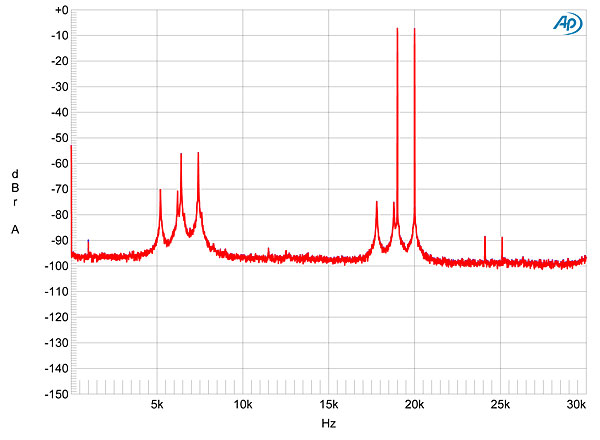
 When I tested the behavior of the SI-300.2d's digital input with an equal mix of 19 and 20kHz tones peaking at 0dBFS, the result were also anomalous. Fig.18 shows the spectrum with 44.1kHz data and upsampling bypassed. Intermodulation products are all low in level, but there is some modulation of the noise floor around the tones. By contrast, fig.19 shows the spectrum with the same data upsampled to 352.8kHz. The noise-floor modulation has disappeared, but some higher-order products are now present. And with DSD128 upsampling, the spectrum is just perverse (fig.20).
 The Cary SI-300.2d's measured performance is a mixed bag. The amplifier itself is a straightforward, competently engineered, solid-state, class-A/B design, and while its heatsinking is, in absolute terms, inadequate for so powerful an amplifier, this will probably not be a problem in practical use unless the Cary is used for dancing at a party. Its USB input offers excellent performance, as KM found. However, with S/PDIF and AES/EBU data and upsampling, which KM didn't audition, some of the measurements were perverse—see the Bryston review elsewhere in this issue for how these measurements should look—while others suggested that the sound will change somewhat arbitrarily, depending on the input sample rate and/or on which upsampling rate and/or format have been chosen.—John Atkinson
Fig.1 Cary SI-300.2d, frequency response with volume control set to its maximum at 2.83V into: simulated loudspeaker load (gray), 8 ohms (left channel blue, right red), 4 ohms (left cyan, right magenta), 2 ohms (green) (0.5dB/vertical div.).
Fig.2 Cary SI-300.2d, small-signal, 10kHz squarewave into 8 ohms.
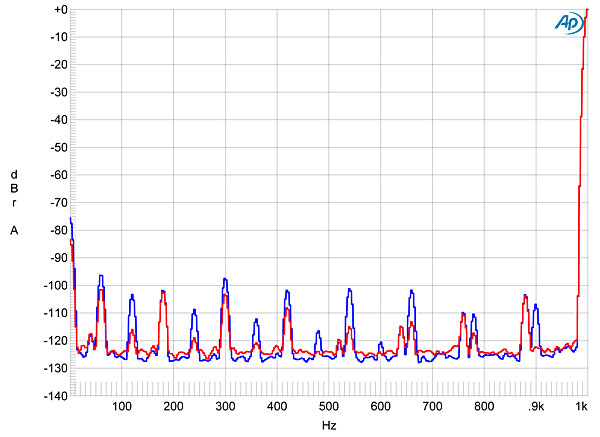
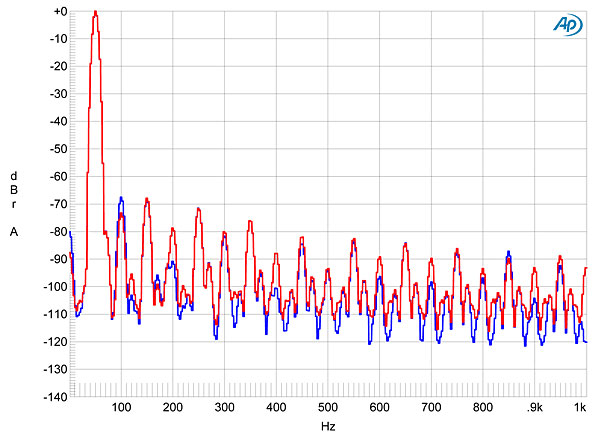
Channel separation below 1kHz was good rather than great, at >70dB, but at 20kHz decreased to 46dB L–R and 50dB R–L. Spectral analysis of the SI-300.2d's low-frequency noise floor (fig.3) revealed the presence of both odd- and even-order harmonics of the 60Hz AC supply frequency, but as these lay at or below 100dB below 1W into 8 ohms, they will be inconsequential. The wideband, unweighted signal/noise ratio ref. that level, taken with the inputs shorted to ground but the volume set to its maximum, was a respectable 80.3dB, improving to 92.6dB when A-weighted.
Fig.3 Cary SI-300.2d, spectrum of 1kHz sinewave, DC–1kHz, at 1W into 8 ohms (linear frequency scale).
Fig.4 Cary SI-300.2d, THD+N (%) vs 1kHz continuous output power into 8 ohms.
Fig.5 Cary SI-300.2d, THD+N (%) vs 1kHz continuous output power into 4 ohms.
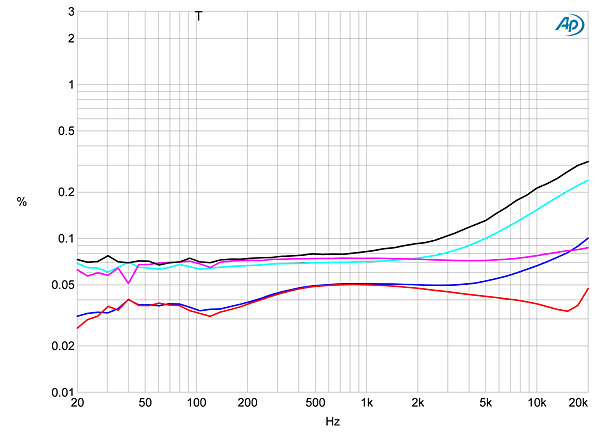
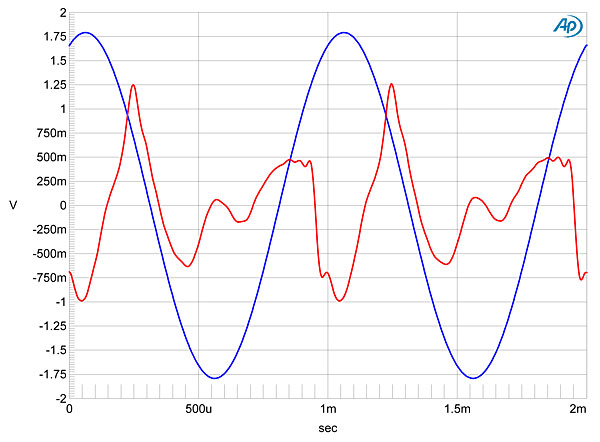
Figs. 4 and 5 reveal that the THD+N was respectably low at powers below 10W and, even at a higher power, remained below 0.1% into 8 ohms across the audioband (fig.6, blue and red traces), with the right channel driving 4 ohms (magenta trace). The left channel was less linear than the right into low impedances and above 2kHz or so, however. The residual distortion waveform (fig.7) implies a complicated mix of second and third harmonics, and spectral analysis reveals that higher-order harmonics are also present at higher powers (fig.8). Intermodulation distortion was relatively low (fig.9), with the difference component at 1kHz resulting from an equal mix of 19 and 20kHz tones lying 70dB below the signal's peak level (0.03%).
Fig.6 Cary SI-300.2d, THD+N (%) vs frequency at 17.9V into: 8 ohms (left channel blue, right red), 4 ohms (left cyan, right magenta), 2 ohms (left gray).
Fig.7 Cary SI-300.2d, 1kHz waveform at 11W into 8 ohms, 0.022% THD+N (blue); distortion and noise waveform with fundamental notched out (red, not to scale).
Fig.8 Cary SI-300.2d, spectrum of 50Hz sinewave, DC–1kHz, at 50W into 8 ohms (linear frequency scale).
Fig.9 Cary SI-300.2d, HF intermodulation spectrum, DC–30kHz, 19+20kHz at 100W peak into 4 ohms (linear frequency scale).
Fig.10 Cary SI-300.2d, impulse response (one sample at 0dBFS, 44.1kHz sampling, 4ms time window).
Fig.11 Cary SI-300.2d, wideband spectrum of white noise at –4dBFS (left channel red, right magenta) and 19.1kHz tone at 0dBFS (left blue, right cyan), with data sampled at 44.1kHz (20dB/vertical div.).
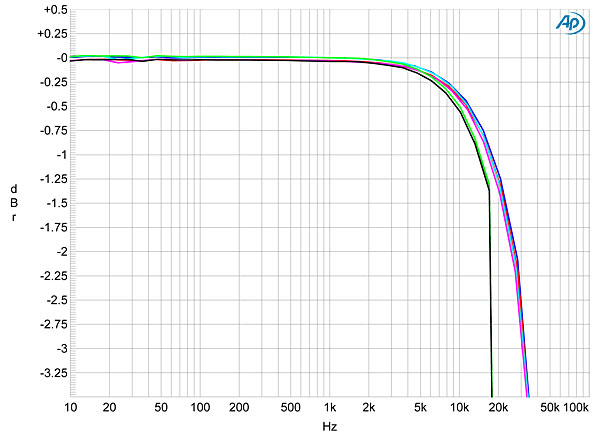
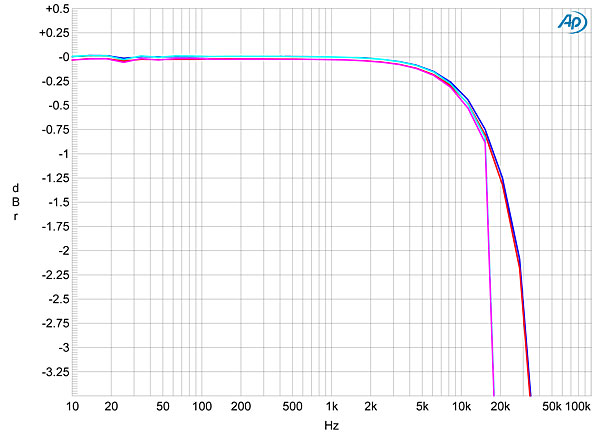
When I examined the Cary's frequency response with TosLink and AES/EBU data, and with and without upsampling, I uncovered some problems. Fig.12 shows the responses without upsampling and with data sampled at 44.1, 96, and 192kHz; while the 44.1kHz response drops sharply above 18kHz, the response at all three rates rolls off a little early in the top audio octave, and the ultrasonic response with 192kHz data extends no higher than with 96kHz data. Switching in PCM upsampling didn't change these responses (fig.13), but when I looked at the effect of DSD upsampling, it didn't matter whether I chose DSD64, DSD128, or DSD256—the original PCM data appeared to be first downsampled to 44.1kHz. This is shown graphically in fig.14, where the blue and red traces plot the response with 96kHz data upsampled to 384kHz, the cyan and magenta traces the response with the same 96kHz data upsampled to DSD256.
Fig.12 Cary SI-300.2d, no upsampling, frequency response at –12dBFS into 100k ohms with data sampled at: 44.1kHz (left channel green, right gray), 96kHz (left cyan, right magenta), 192kHz (left blue, right red) (0.5dB/vertical div.).
Fig.13 Cary SI-300.2d, PCM upsampling, frequency response at –12dBFS into 100k ohms with data sampled at: 44.1kHz (left channel green, right gray), 96kHz (left cyan, right magenta), 192kHz (left blue, right red) (0.5dB/vertical div.).
Fig.14 Cary SI-300.2d, frequency response at –12dBFS into 100k ohms with data sampled at 192kHz with upsampling to: 384kHz (left channel blue, right red), DSD256 (left cyan, right magenta) (0.5dB/vertical div.).
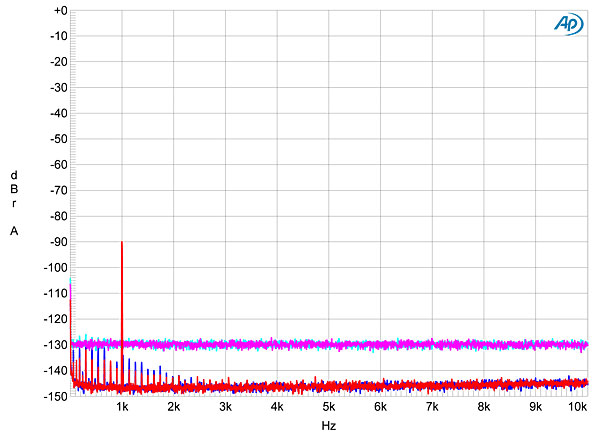
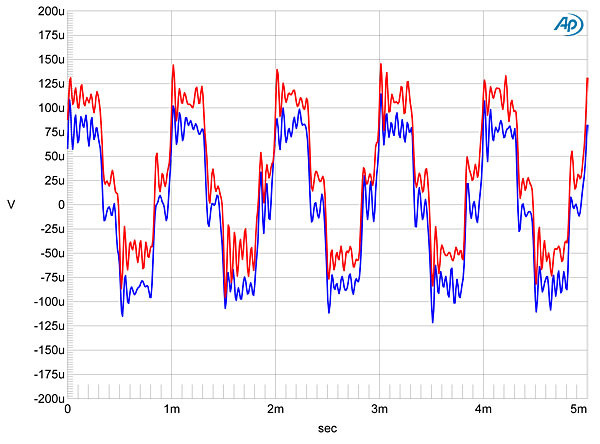
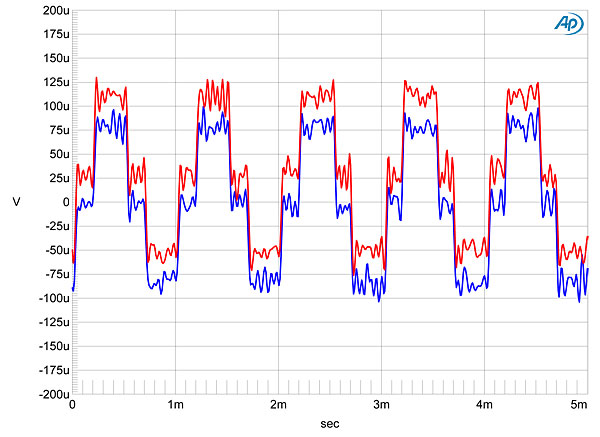
Fig.15 shows a spectral analysis of the SI-300.2d's noise floor with a 24-bit/1kHz tone at –90dBFS with 16- and 24-bit AES/EBU data. The increase in bit depth drops the noise floor by around 27dB, suggesting DAC resolution of between 20 and 21 bits, which is excellent. The Cary's reproduction of an undithered 16-bit/1kHz tone at exactly –90.31dBFS (fig.16) clearly shows the three DC voltage levels described by the data, as well as the minimum-phase behavior of the reconstruction filter. Switching in upsampling gave a waveform more typical of a time-symmetrical FIR filter (fig.17).
Fig.15 Cary SI-300.2d, spectrum with noise and spuriae of dithered 1kHz tone at –90dBFS with: 16-bit data (left channel cyan, right magenta), 24-bit data (left blue, right red) (20dB/vertical div.).
Fig.16 Cary SI-300.2d, no upsampling, waveform of undithered 1kHz sinewave at –90.31dBFS, 16-bit data (left channel blue, right red).
Fig.17 Cary SI-300.2d, 352.8kHz upsampling, waveform of undithered 1kHz sinewave at –90.31dBFS, 16-bit data (left channel blue, right red).
Fig.18 Cary SI-300.2d, no upsampling, HF intermodulation spectrum, DC–30kHz, 19+20kHz at 0dBFS into 100k ohms, 44.1kHz data (left channel blue, right red; linear frequency scale).
Fig.19 Cary SI-300.2d, 352.8kHz upsampling, HF intermodulation spectrum, DC–30kHz, 19+20kHz at 0dBFS into 100k ohms, 44.1kHz data (left channel blue, right red; linear frequency scale).
Fig.20 Cary SI-300.2d, DSD128 upsampling, HF intermodulation spectrum, DC–30kHz, 19+20kHz at 0dBFS into 100k ohms, 44.1kHz data (left channel blue, right red; linear frequency scale).
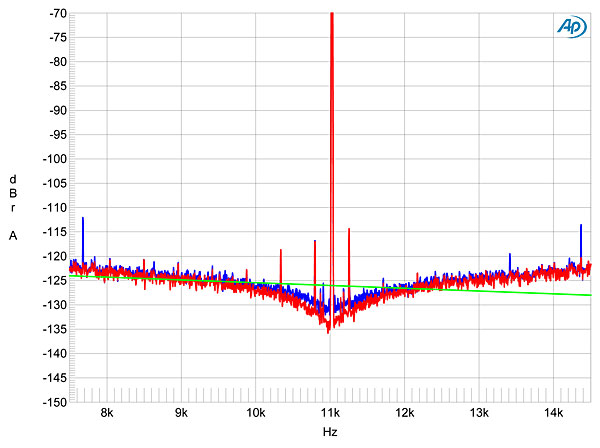
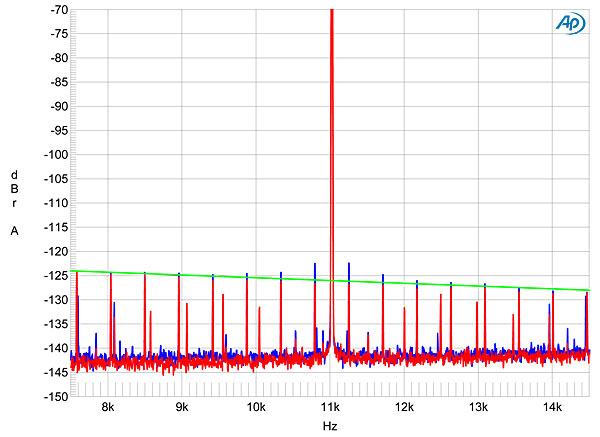
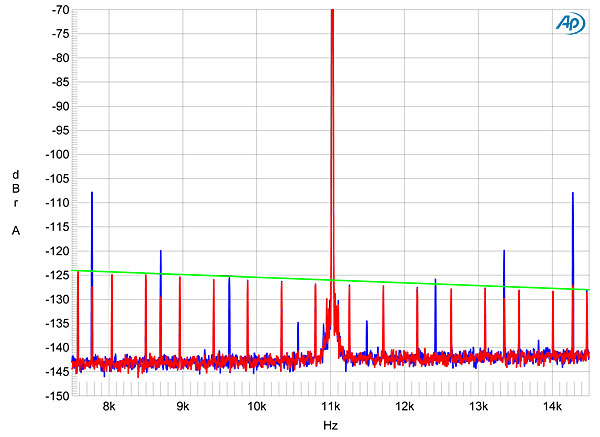
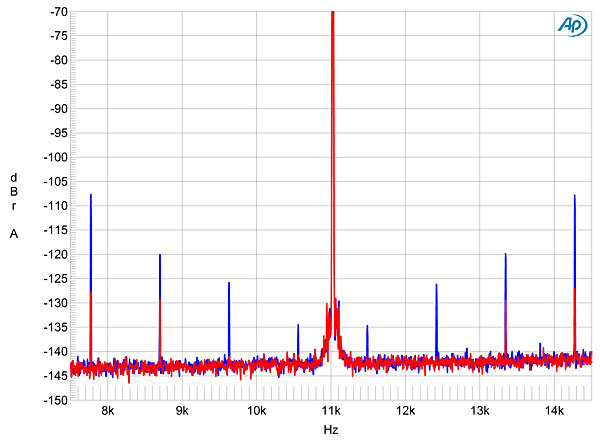
The spectrum of the SI-300.2d's rejection of word-clock jitter, with 44.1Hz J-Test data and upsampling bypassed (fig.21), shows the same modulation of the noise floor as in the intermodulation tests. This obscures the off-order harmonics of the low-frequency, LSB-level squarewave, other than a pair to either side of the spike representing the 11.025kHz tone. There is also a pair of sidebands present at ±3.8kHz, in the left channel only. Neither these sidebands nor the noise-floor modulation was present when I repeated the test with USB data (fig.22), but the sidebands remained when I upsampled TosLink data to 352.8kHz (fig.23), or repeated the test with 24-bit data (fig.24).
Fig.21 Cary SI-300.2d, no upsampling, high-resolution jitter spectrum of analog output signal, 11.025kHz at –6dBFS, sampled at 44.1kHz with LSB toggled at 229Hz: 16-bit TosLink data (left channel blue, right red). Center frequency of trace, 11.025kHz; frequency range, ±3.5kHz.
Fig.22 Cary SI-300.2d, no upsampling, high-resolution jitter spectrum of analog output signal, 11.025kHz at –6dBFS, sampled at 44.1kHz with LSB toggled at 229Hz: 16-bit USB data (left channel blue, right red). Center frequency of trace, 11.025kHz; frequency range, ±3.5kHz.
Fig.23 Cary SI-300.2d, 352.8kHz upsampling, high-resolution jitter spectrum of analog output signal, 11.025kHz at –6dBFS, sampled at 44.1kHz with LSB toggled at 229Hz: 16-bit TosLink data (left channel blue, right red). Center frequency of trace, 11.025kHz; frequency range, ±3.5kHz.
Fig.24 Cary SI-300.2d, 352.8kHz upsampling, high-resolution jitter spectrum of analog output signal, 11.025kHz at –6dBFS, sampled at 44.1kHz with LSB toggled at 229Hz: 24-bit TosLink data (left channel blue, right red). Center frequency of trace, 11.025kHz; frequency range, ±3.5kHz.


