Red Rose Music founder and CEO Mark Levinson may have lost the rights to use his own name, but not the good timing that helped make him a successful businessman and an accomplished bass player. (According to his online bio, Levinson has sat in with the likes of John Coltrane, Sonny Stitt, Chick Corea, and Keith Jarrett.)  After designing the mixer used onstage at Woodstock (pretty good timing, I'd say!), Levinson decided to enter the home hi-fi market with a new solid-state amplifier—hardly a rational business decision in 1971, when he founded Mark Levinson Audio Systems, Ltd., the company that still bears his name and has been owned by Madrigal (now part of Harman International) since the early 1980s. Thirty years ago, the once hot American hi-fi industry had cooled off—literally. Solid-state audio had made reasonably good sound less exotic and less costly. Premier first-wave audio companies like Marantz, Scott, and Fisher entered the solid-state market but were unable to compete with Japanese imports. By the time Sanyo bought the company, Fisher's most important asset was probably its name recognition. Everything measured the same—and, of course, better than any of the old-fashioned tube gear it replaced—so it all sounded better and about the same, according to the mainstream audio magazines of the day. The industry atrophied and consumer interest waned.
Levinson arrived on the scene with a hand-assembled, high-tech, solid-state amplifier built to a new high standard, boutique prices, and startlingly good sound. Mark Levinson Audio Systems, along with a few other new, now-familiar names, oversaw the death of American hi-fi and the birth of high-end audio. Hi-fi had grown out of the love of music. High-end audio encompassed that while cultivating the snob appeal aspects of the hobby. You're kidding yourself if you think otherwise. Owning a high-end audio system became, for some, a status symbol, like a fine watch or car. The establishment of that cachet helped grow the audio business and make it healthy during the 1970s and '80s. While Saul Marantz, Avery Fisher, and others had named their companies after themselves, it took Mark Levinson to swell the concept to Ralph Lauren-like proportions. Throughout his audio career, including today's Red Rose Music, when you bought a Mark Levinson product, you bought the man.
For reasons not connected with his products' quality, Levinson had to sell his namesake company to Madrigal in the early 1980s. However, the latter company has admirably and successfully kept both the products' credibility and the important cachet intact. Levinson himself went on to found Cello Film and Music, which made products even more specialized, expensive, and exclusive. Cello produced ultra-complex, world-class audio components and complete custom sound systems for the high-rollers in the new home-theater market, and sold only from its own showrooms. Cello also bridged the gap between the consumer and professional audio worlds with products like the ultra-sophisticated Audio Palette equalizer. Levinson had envisioned and successfully tapped into yet another market. However, after 15 years, perhaps fearing he could not effectively compete in the fast-changing market for high-tech surround-sound processors, or in a market increasingly dominated by custom-install houses, in late 1998 he abruptly sold his interest in Cello. With Levinson out of the picture, Cello quickly collapsed, while Levinson launched Red Rose Music. Background to Foreground
After designing the mixer used onstage at Woodstock (pretty good timing, I'd say!), Levinson decided to enter the home hi-fi market with a new solid-state amplifier—hardly a rational business decision in 1971, when he founded Mark Levinson Audio Systems, Ltd., the company that still bears his name and has been owned by Madrigal (now part of Harman International) since the early 1980s. Thirty years ago, the once hot American hi-fi industry had cooled off—literally. Solid-state audio had made reasonably good sound less exotic and less costly. Premier first-wave audio companies like Marantz, Scott, and Fisher entered the solid-state market but were unable to compete with Japanese imports. By the time Sanyo bought the company, Fisher's most important asset was probably its name recognition. Everything measured the same—and, of course, better than any of the old-fashioned tube gear it replaced—so it all sounded better and about the same, according to the mainstream audio magazines of the day. The industry atrophied and consumer interest waned.
Levinson arrived on the scene with a hand-assembled, high-tech, solid-state amplifier built to a new high standard, boutique prices, and startlingly good sound. Mark Levinson Audio Systems, along with a few other new, now-familiar names, oversaw the death of American hi-fi and the birth of high-end audio. Hi-fi had grown out of the love of music. High-end audio encompassed that while cultivating the snob appeal aspects of the hobby. You're kidding yourself if you think otherwise. Owning a high-end audio system became, for some, a status symbol, like a fine watch or car. The establishment of that cachet helped grow the audio business and make it healthy during the 1970s and '80s. While Saul Marantz, Avery Fisher, and others had named their companies after themselves, it took Mark Levinson to swell the concept to Ralph Lauren-like proportions. Throughout his audio career, including today's Red Rose Music, when you bought a Mark Levinson product, you bought the man.
For reasons not connected with his products' quality, Levinson had to sell his namesake company to Madrigal in the early 1980s. However, the latter company has admirably and successfully kept both the products' credibility and the important cachet intact. Levinson himself went on to found Cello Film and Music, which made products even more specialized, expensive, and exclusive. Cello produced ultra-complex, world-class audio components and complete custom sound systems for the high-rollers in the new home-theater market, and sold only from its own showrooms. Cello also bridged the gap between the consumer and professional audio worlds with products like the ultra-sophisticated Audio Palette equalizer. Levinson had envisioned and successfully tapped into yet another market. However, after 15 years, perhaps fearing he could not effectively compete in the fast-changing market for high-tech surround-sound processors, or in a market increasingly dominated by custom-install houses, in late 1998 he abruptly sold his interest in Cello. With Levinson out of the picture, Cello quickly collapsed, while Levinson launched Red Rose Music. Background to Foreground
Red Rose Music appears to be aimed at music-loving baby-boomers weaned on hi-fi, long since separated from the scene, but now nearing retirement and looking to relive the experience without the audiophile neurosis. Mark Levinson also might be seeing an opportunity to finally penetrate the frustrating general assumption in the high-quality upscale market that "Bose" is roughly equivalent to "Mercedes" and "Rolex." Why else would he have set up shop in the former museum store at the hip, eclectic, Whitney Museum in New York City? It's hardly a place where audiophiles congregate. He's probably there because he believes he's got a system and a story that non-audiophile museum goers will buy into when they hear them.
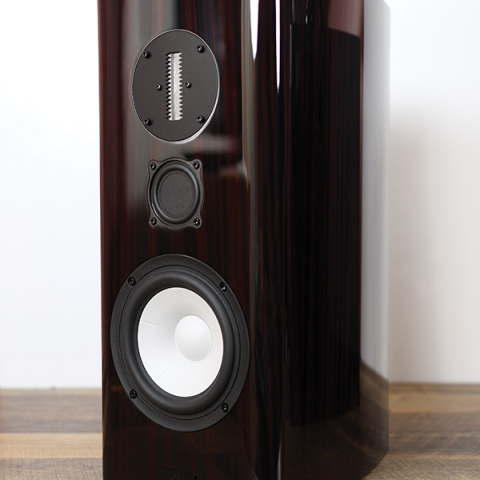
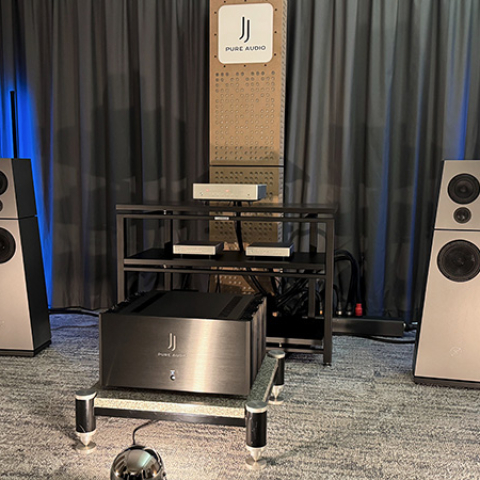
The Red Rose system features vacuum-tube amplification (Levinson bought the electronics division of AudioPrism), loudspeakers with ribbon tweeters, SACD players, maybe even a turntable. The company also includes the DSD-based Red Rose record label, which will issue Levinson-recorded SACDs. Don't have an SACD player? You can get the music on cassette, according to the Red Rose website, because cassette captures the stressless essence of SACD better than CD. No argument there!
After designing the mixer used onstage at Woodstock (pretty good timing, I'd say!), Levinson decided to enter the home hi-fi market with a new solid-state amplifier—hardly a rational business decision in 1971, when he founded Mark Levinson Audio Systems, Ltd., the company that still bears his name and has been owned by Madrigal (now part of Harman International) since the early 1980s. Thirty years ago, the once hot American hi-fi industry had cooled off—literally. Solid-state audio had made reasonably good sound less exotic and less costly. Premier first-wave audio companies like Marantz, Scott, and Fisher entered the solid-state market but were unable to compete with Japanese imports. By the time Sanyo bought the company, Fisher's most important asset was probably its name recognition. Everything measured the same—and, of course, better than any of the old-fashioned tube gear it replaced—so it all sounded better and about the same, according to the mainstream audio magazines of the day. The industry atrophied and consumer interest waned. Red Rose Music appears to be aimed at music-loving baby-boomers weaned on hi-fi, long since separated from the scene, but now nearing retirement and looking to relive the experience without the audiophile neurosis. Mark Levinson also might be seeing an opportunity to finally penetrate the frustrating general assumption in the high-quality upscale market that "Bose" is roughly equivalent to "Mercedes" and "Rolex." Why else would he have set up shop in the former museum store at the hip, eclectic, Whitney Museum in New York City? It's hardly a place where audiophiles congregate. He's probably there because he believes he's got a system and a story that non-audiophile museum goers will buy into when they hear them.