Why, in loudspeaker reviews, is impedance measured (assuming that the magazine in question bothers to measure anything)? Generally, for one principal reason only: to establish whether the speaker presents an "easy" or a "difficult" load to its partnering amplifier. In the design context, much more information can be extracted from a graph of speaker impedance vs frequency—such as details of the bass alignment, and indications of internal or structural resonances that can be difficult to identify by acoustical measurements. But for a magazine audience, the principal interest in a loudspeaker's load impedance lies in gaining some indication of its compatibility with a given amplifier.
So you may be surprised to learn that conventional measurements of speaker impedance don't do a very good job of it. This is not—as Matti Otala suggested in the 1980s (footnotes 1, 2)—because loudspeakers replaying music signals sometimes present impedance loads significantly less than indicated by conventional steady-state measurements. Although Otala and colleagues did demonstrate that you can contrive signals that will cause loudspeakers to behave this way, they never offered any evidence that such waveforms occur with significant regularity within music recordings.
That was left to others to check, and their results suggest that [sigh of relief] this is not a phenomenon with any practical relevance. That is what Dolby Labs' Eric Benjamin found when he investigated the issue in 1994 (footnote 3). It's what I found, too, when I unwittingly reprised some of Benjamin's work in 2005 (footnote 4), albeit using a software-analysis approach rather than an oscilloscope. While in this context you can't prove a negative—there is always the possibility that some pieces of music will contain just the waveform necessary for a particular speaker to demonstrate the Otala effect—the available evidence suggests that this probably occurs extremely rarely, if at all.
No, the problem with conventional impedance measurements lies not in the measurement method itself but the way in which its results are presented. To understand why this is the case, we need first to look at the amplifier output stage—here I consider only class-B transistor amplifiers—and what constraints the output devices have to work within if they are not to suffer catastrophic failure.
Out of bounds
Fig.1 shows the safe operating area (SOA) graph for a notional output device that might be used in an audio amplifier. Current (in amps) is plotted on the vertical axis and voltage (in volts) on the horizontal axis, the SOA being bounded along each by the device's absolute maximum current and voltage ratings, which must not be exceeded under any circumstances. For our device, these are 25A and 120V, respectively. The other boundary to the SOA, which accounts for most of its perimeter, is the device's maximum power dissipation; ie, the maximum product of current through and voltage across the device, which here is 125W. Note that this is very much less than we get by multiplying the absolute maximum ratings (25A x 120V = 3000W), which is why the SOA is shaped like a rectangle with a very large, hyperbola-shaped bite taken out of its top right corner—that is, provided the current and voltage scales are linear. In most transistor specification sheets the two axes are in fact logarithmic, in which case the same SOA looks like fig.2 (which has the advantage of making the SOA appear larger . . . ).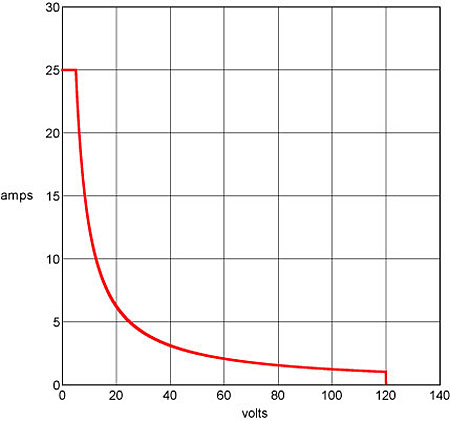 Fig.1 Safe operating area of a notional output transistor.
 Fig.2 As fig.1 but with logarithmic axes, as typically used in transistor data sheets.
For various reasons, this is an oversimplification of actual SOAs. We haven't considered another limiting factor, secondary breakdown, which takes another bite out of the SOA; neither have we considered the effect of time. Many published SOAs show a number of superimposed graphs: one for DC conditions, as we've just considered, and others for shorter signal intervals, for which the SOA is somewhat larger. But no matter: our simplified SOA is quite good enough to illustrate the point that needs making.
Let's consider what happens when our notional output transistor is used, as one half of a class-B push-pull output stage, to drive a load. In the first instance we'll consider a resistive dummy load, as is usually employed for amplifier power measurements. If the dummy load has a resistance of 8 ohms, then at the transistor's 120V maximum the current will be (120/8 =) 15A. By joining these two points on the axes of the SOA graph we construct for this resistance a so-called load line (blue line in fig.3) that represents the combinations of voltage across and current through the device when driving this load. Immediately we see that this load line exceeds the SOA, and that the voltage across the transistor (and therefore the peak voltage deliverable to the load) must be reduced. In fact, it has to be cut to 63V in order for the load line (green) to just graze the limiting curve imposed by the device's power rating. If we now plot the equivalent for a 4 ohm resistor, the result is the pink load line, and the amplifier's rail voltage has decreased still further, to 44V.
Fig.2 As fig.1 but with logarithmic axes, as typically used in transistor data sheets.
For various reasons, this is an oversimplification of actual SOAs. We haven't considered another limiting factor, secondary breakdown, which takes another bite out of the SOA; neither have we considered the effect of time. Many published SOAs show a number of superimposed graphs: one for DC conditions, as we've just considered, and others for shorter signal intervals, for which the SOA is somewhat larger. But no matter: our simplified SOA is quite good enough to illustrate the point that needs making.
Let's consider what happens when our notional output transistor is used, as one half of a class-B push-pull output stage, to drive a load. In the first instance we'll consider a resistive dummy load, as is usually employed for amplifier power measurements. If the dummy load has a resistance of 8 ohms, then at the transistor's 120V maximum the current will be (120/8 =) 15A. By joining these two points on the axes of the SOA graph we construct for this resistance a so-called load line (blue line in fig.3) that represents the combinations of voltage across and current through the device when driving this load. Immediately we see that this load line exceeds the SOA, and that the voltage across the transistor (and therefore the peak voltage deliverable to the load) must be reduced. In fact, it has to be cut to 63V in order for the load line (green) to just graze the limiting curve imposed by the device's power rating. If we now plot the equivalent for a 4 ohm resistor, the result is the pink load line, and the amplifier's rail voltage has decreased still further, to 44V.
 Fig.3 SOA of fig.1 with resistive load lines added (green line, 8 ohms; pink line, 4 ohms).
But loudspeaker loads are not, in general, resistive. They comprise complex impedances with both resistive and reactive (capacitive and inductive) elements, as a result of which the voltage and current waveforms are, at most frequencies, out of phase with each other. This is why, for a complete characterization of a speaker's load impedance, both modulus vs frequency and phase vs frequency have to be determined. Worst-case phase angles of 60° or more are not unusual in loudspeakers, so let's see what happens when we plot the load line for an 8 ohm load having a 60° phase angle, using the 63V rail voltage we determined for the resistive case. As shown in fig.4—where the current axis has been zoomed for clarity—what was previously a straight load line (green, as before) is now half an ellipse (orange trace), and this comprehensively busts the SOA budget. To prevent this, we have to reduce the rail voltage to 33V (purple trace), at which the load line again just grazes the SOA's limiting power boundary. Note that this is a more severe voltage reduction than is imposed by a 4 ohm resistive load. As far as our amplifier is concerned, then, an 8 ohm load with 60° phase angle is considerably more challenging that a 4 ohm load with 0° phase angle.
Fig.3 SOA of fig.1 with resistive load lines added (green line, 8 ohms; pink line, 4 ohms).
But loudspeaker loads are not, in general, resistive. They comprise complex impedances with both resistive and reactive (capacitive and inductive) elements, as a result of which the voltage and current waveforms are, at most frequencies, out of phase with each other. This is why, for a complete characterization of a speaker's load impedance, both modulus vs frequency and phase vs frequency have to be determined. Worst-case phase angles of 60° or more are not unusual in loudspeakers, so let's see what happens when we plot the load line for an 8 ohm load having a 60° phase angle, using the 63V rail voltage we determined for the resistive case. As shown in fig.4—where the current axis has been zoomed for clarity—what was previously a straight load line (green, as before) is now half an ellipse (orange trace), and this comprehensively busts the SOA budget. To prevent this, we have to reduce the rail voltage to 33V (purple trace), at which the load line again just grazes the SOA's limiting power boundary. Note that this is a more severe voltage reduction than is imposed by a 4 ohm resistive load. As far as our amplifier is concerned, then, an 8 ohm load with 60° phase angle is considerably more challenging that a 4 ohm load with 0° phase angle.
 Fig.4 Same SOA as in fig.3, this time with zoomed current axis, showing elliptical load lines for an 8 ohm impedance with 60° phase angle.
Fig.4 makes the point that impedance phase angle is a critical factor when assessing, from the amplifier's point of view, how severe a load a loudspeaker is. But even if modulus vs frequency and phase vs frequency graphs are both plotted, we still don't get a clear picture of this, because what matters is the interplay of modulus and phase angle. Generally speaking, as we will see, it is not the frequency where the minimum modulus occurs at which the loudspeaker represents the severest amplifier load, nor will the amplifier be stressed equivalently to the speaker if we test it using a resistive load equal to the speaker's minimum modulus.
Fig.4 Same SOA as in fig.3, this time with zoomed current axis, showing elliptical load lines for an 8 ohm impedance with 60° phase angle.
Fig.4 makes the point that impedance phase angle is a critical factor when assessing, from the amplifier's point of view, how severe a load a loudspeaker is. But even if modulus vs frequency and phase vs frequency graphs are both plotted, we still don't get a clear picture of this, because what matters is the interplay of modulus and phase angle. Generally speaking, as we will see, it is not the frequency where the minimum modulus occurs at which the loudspeaker represents the severest amplifier load, nor will the amplifier be stressed equivalently to the speaker if we test it using a resistive load equal to the speaker's minimum modulus.
Footnote 1 M. Otala et al, "Input Current Requirements of High-Quality Loudspeaker Systems," AES 73rd Convention, March 1983 (available from www.aes.org). Footnote 2 M. Otala et al, "Peak Current Requirement of Commercial Loudspeaker Systems," AES 79th Convention, October 1985 (available from www.aes.org).
Footnote 3 E. Benjamin, "Audio Power Amplifiers for Loudspeaker Loads," JAES, Vol.42 No.9, September 1994 (available from www.aes.org).
Footnote 4 K. Howard, "Current Affairs," Hi-Fi News, February 2006.
Fig.1 shows the safe operating area (SOA) graph for a notional output device that might be used in an audio amplifier. Current (in amps) is plotted on the vertical axis and voltage (in volts) on the horizontal axis, the SOA being bounded along each by the device's absolute maximum current and voltage ratings, which must not be exceeded under any circumstances. For our device, these are 25A and 120V, respectively. The other boundary to the SOA, which accounts for most of its perimeter, is the device's maximum power dissipation; ie, the maximum product of current through and voltage across the device, which here is 125W. Note that this is very much less than we get by multiplying the absolute maximum ratings (25A x 120V = 3000W), which is why the SOA is shaped like a rectangle with a very large, hyperbola-shaped bite taken out of its top right corner—that is, provided the current and voltage scales are linear. In most transistor specification sheets the two axes are in fact logarithmic, in which case the same SOA looks like fig.2 (which has the advantage of making the SOA appear larger . . . ).
Fig.1 Safe operating area of a notional output transistor.
Fig.2 As fig.1 but with logarithmic axes, as typically used in transistor data sheets.
For various reasons, this is an oversimplification of actual SOAs. We haven't considered another limiting factor, secondary breakdown, which takes another bite out of the SOA; neither have we considered the effect of time. Many published SOAs show a number of superimposed graphs: one for DC conditions, as we've just considered, and others for shorter signal intervals, for which the SOA is somewhat larger. But no matter: our simplified SOA is quite good enough to illustrate the point that needs making.
Fig.3 SOA of fig.1 with resistive load lines added (green line, 8 ohms; pink line, 4 ohms).
But loudspeaker loads are not, in general, resistive. They comprise complex impedances with both resistive and reactive (capacitive and inductive) elements, as a result of which the voltage and current waveforms are, at most frequencies, out of phase with each other. This is why, for a complete characterization of a speaker's load impedance, both modulus vs frequency and phase vs frequency have to be determined. Worst-case phase angles of 60° or more are not unusual in loudspeakers, so let's see what happens when we plot the load line for an 8 ohm load having a 60° phase angle, using the 63V rail voltage we determined for the resistive case. As shown in fig.4—where the current axis has been zoomed for clarity—what was previously a straight load line (green, as before) is now half an ellipse (orange trace), and this comprehensively busts the SOA budget. To prevent this, we have to reduce the rail voltage to 33V (purple trace), at which the load line again just grazes the SOA's limiting power boundary. Note that this is a more severe voltage reduction than is imposed by a 4 ohm resistive load. As far as our amplifier is concerned, then, an 8 ohm load with 60° phase angle is considerably more challenging that a 4 ohm load with 0° phase angle.
Fig.4 Same SOA as in fig.3, this time with zoomed current axis, showing elliptical load lines for an 8 ohm impedance with 60° phase angle.
Footnote 1 M. Otala et al, "Input Current Requirements of High-Quality Loudspeaker Systems," AES 73rd Convention, March 1983 (available from www.aes.org). Footnote 2 M. Otala et al, "Peak Current Requirement of Commercial Loudspeaker Systems," AES 79th Convention, October 1985 (available from www.aes.org).