Looked at from one viewpoint, DVD-Audio and SACD appear to be exercises in sheer profligacy. In the case of DVD-A, why provide a maximum bandwidth almost five times what is conventionally taken to be the audible frequency range, and couple it to a dynamic-range capability far in excess of that achievable by the microphones used to record the sound? In the case of SACD, why provide a potential bandwidth in excess of 1.4MHz, only to fill more than 95% of it with quantization noise?
These questions have answers, and the topics they encompass are anything but trivial: they relate to fundamental questions about how we perceive sound in general, and reproduced sound in particular. But the subject of this article is not the various justifications for DVD-A and SACD that have been proffered, with which I expect most of you reading this will by now be familiar. For the pragmatic audiophile, it is sufficient, in any case, to know that the best sound from the new high-resolution media is significantly better than the best attainable from CD. No further justification is ultimately required—although many us would add the rider that it would be rather useful to understand why the sound can be significantly better.
What I want to look at here is more prosaic but nonetheless important: Just what is being delivered on commercial DVD-Audio and SACD releases, and not only from the viewpoint of signal bandwidth? New signal sources, particularly ones with wider bandwidth and dynamic-range capability, present the possibility that the partnering equipment will be stressed in ways it wasn't previously. These are issues equipment designers need to know about, and may well have been researched by some of them in the privacy of their own laboratories. But investigation in the audio press has, to my knowledge, been surprisingly thin on the ground. High time, therefore, to knuckle down and elucidate just what DVD-A and SACD players are delivering—both good and bad.
First, though, I need to explain the various measurements I've made—of a total of 13 tracks from 15 discs culled from a broad selection of DVD-A and SACD releases—because some of them are certain to be unfamiliar. Please resist the temptation to flick forward to the results until I've had the opportunity to explain their provenance.
Spectra
The first set of graphs for each track are spectral analyses of the left- and right-channel signal content. (Only the discs' two-channel stereo tracks were assessed, not the multichannel content (where available).) Sounds familiar enough, but there's a twist. Most of the spectral analyses you see published in equipment reviews—showing harmonic or IM distortion residuals, for instance—are averaged, for the very good reason that averaging evens out the noise floor. This averaging doesn't lower the noise floor (a common misapprehension), but if sufficient averages are taken, it can reduce the noise floor to a relatively flat line (assuming the noise spectrum itself is flat) with only relatively small irregularities. In this way, low-level spectral features can be identified that would otherwise be obscured within the "grass" of the noise floor. Averaging is contraindicated, however, when you're looking—as I wanted to when analyzing the DVD-Audio and SACD tracks—for what may be only brief excursions into the high frequencies. For this, you need to capture an "envelope" spectrum—one that plots the maximum amplitude recorded in each frequency bin across the entire duration of the track.
The FFT analysis software I habitually use includes a peak-hold capability that should accomplish this, but, faced with some unexpected results, I decided to write some code of my own. In the long run—ie, once the software had been written and validated—this DIY approach had the advantage of speed in that one measurement run generated both average and envelope spectra simultaneously, and plotted the results in an enhanced metafile ready for publishing. (Much less tedious than exporting data to the clipboard, pasting it into a text document, importing it into some graphing software, then exporting the graph as a metafile—which is what I'd have had to do otherwise, many times over.)
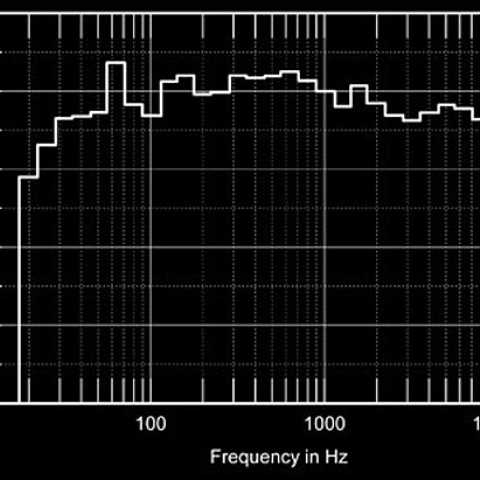
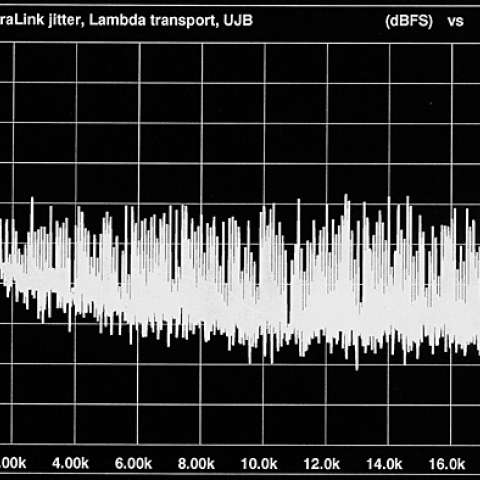
Figs.1-3 show examples of the resulting spectra, in this case for 1kHz test tones, which were used to ensure that a 0dBFS signal from the source was recorded at 0dBFS in the hard-disk WAV file (for which purpose a "passive pot" gain control was inserted between the player and computer). To capture 24-bit/192kHz recordings from DVD-A, and anything from SACD, you have no choice but to record from the analog output of the player via the analog input of a 24/192-capable soundcard (in this case, a Lynx Audio L22), because digital output data are not available.
 Fig.1 Envelope (red trace) and average (blue) spectra for analog 24-bit/192kHz recording via the Pioneer DV-939A and Lynx Audio L22.
 Fig.2 Envelope and average spectra for S/PDIF 24-bit/96kHz recording via the Pioneer DV-939A and Lynx Audio L22.
 Fig.3 Envelope and average spectra for analog 24-bit/192kHz recording via the Philips SACD1000 (50kHz output filter setting) and Lynx Audio L22.
At 96kHz or lower sampling rates on DVD-A, you can sometimes access the raw digital data via S/PDIF, depending on whether the player supports 24/96 digital output and whether the disc allows it. In many cases, DVD-As are coded to force the player to downsample its digital output, which of course reduces the bandwidth—and generally introduces distortion.
Where a 24/96 digital output was available from a 24/96 recording I used it, but most of the transfers to hard disk for this analysis had to be done in the analog domain. Because this inevitably adds noise over and above that present in the recording itself, it's important to establish the noise performance of the player and soundcard in combination. Figs.1-3 do this for: the Pioneer DV-939A DVD-A player via its analog output (fig.1); the Pioneer via its digital output (fig.2); and the Philips SACD1000 SACD player via its analog output (fig.3).
The first two graphs were generated using test signals burned to DVD-R using Minnetonka's discWelder Chrome DVD-A authoring software; the third was obtained using Philips' Super Audio CD DAC Test Disc (3122 783 0063 2). In each case, the amplitude of the tone was 0dBFS, the blue line represents the averaged spectrum (over 30 seconds), and the red line the envelope (peak) spectrum. Note that the frequency scale is linear in order to make clearer the spectral content above 20kHz—on a log frequency scale, this part of the spectrum would be squashed up at the extreme right end of the graph. These plots provide a reference against which all other spectra in this article should be compared.
Readers familiar with FFT analysis will additionally want to know the FFT length, windowing, and overlap used for the spectral analyses, for which the respective answers are: 4096 samples, Hann, and 50%. At 192kHz sampling rate, 4096 samples is equivalent to 21 milliseconds (0.021s), so the envelope spectrum is capable of recording quite short-term features of each file's frequency content. The vertical separation on the envelope and average spectra additionally gives some indication of the music's dynamic range.
Fig.3 Envelope and average spectra for analog 24-bit/192kHz recording via the Philips SACD1000 (50kHz output filter setting) and Lynx Audio L22.
At 96kHz or lower sampling rates on DVD-A, you can sometimes access the raw digital data via S/PDIF, depending on whether the player supports 24/96 digital output and whether the disc allows it. In many cases, DVD-As are coded to force the player to downsample its digital output, which of course reduces the bandwidth—and generally introduces distortion.
Where a 24/96 digital output was available from a 24/96 recording I used it, but most of the transfers to hard disk for this analysis had to be done in the analog domain. Because this inevitably adds noise over and above that present in the recording itself, it's important to establish the noise performance of the player and soundcard in combination. Figs.1-3 do this for: the Pioneer DV-939A DVD-A player via its analog output (fig.1); the Pioneer via its digital output (fig.2); and the Philips SACD1000 SACD player via its analog output (fig.3).
The first two graphs were generated using test signals burned to DVD-R using Minnetonka's discWelder Chrome DVD-A authoring software; the third was obtained using Philips' Super Audio CD DAC Test Disc (3122 783 0063 2). In each case, the amplitude of the tone was 0dBFS, the blue line represents the averaged spectrum (over 30 seconds), and the red line the envelope (peak) spectrum. Note that the frequency scale is linear in order to make clearer the spectral content above 20kHz—on a log frequency scale, this part of the spectrum would be squashed up at the extreme right end of the graph. These plots provide a reference against which all other spectra in this article should be compared.
Readers familiar with FFT analysis will additionally want to know the FFT length, windowing, and overlap used for the spectral analyses, for which the respective answers are: 4096 samples, Hann, and 50%. At 192kHz sampling rate, 4096 samples is equivalent to 21 milliseconds (0.021s), so the envelope spectrum is capable of recording quite short-term features of each file's frequency content. The vertical separation on the envelope and average spectra additionally gives some indication of the music's dynamic range.
The first set of graphs for each track are spectral analyses of the left- and right-channel signal content. (Only the discs' two-channel stereo tracks were assessed, not the multichannel content (where available).) Sounds familiar enough, but there's a twist. Most of the spectral analyses you see published in equipment reviews—showing harmonic or IM distortion residuals, for instance—are averaged, for the very good reason that averaging evens out the noise floor. This averaging doesn't lower the noise floor (a common misapprehension), but if sufficient averages are taken, it can reduce the noise floor to a relatively flat line (assuming the noise spectrum itself is flat) with only relatively small irregularities. In this way, low-level spectral features can be identified that would otherwise be obscured within the "grass" of the noise floor. Averaging is contraindicated, however, when you're looking—as I wanted to when analyzing the DVD-Audio and SACD tracks—for what may be only brief excursions into the high frequencies. For this, you need to capture an "envelope" spectrum—one that plots the maximum amplitude recorded in each frequency bin across the entire duration of the track.
Fig.1 Envelope (red trace) and average (blue) spectra for analog 24-bit/192kHz recording via the Pioneer DV-939A and Lynx Audio L22.
Fig.2 Envelope and average spectra for S/PDIF 24-bit/96kHz recording via the Pioneer DV-939A and Lynx Audio L22.
Fig.3 Envelope and average spectra for analog 24-bit/192kHz recording via the Philips SACD1000 (50kHz output filter setting) and Lynx Audio L22.
At 96kHz or lower sampling rates on DVD-A, you can sometimes access the raw digital data via S/PDIF, depending on whether the player supports 24/96 digital output and whether the disc allows it. In many cases, DVD-As are coded to force the player to downsample its digital output, which of course reduces the bandwidth—and generally introduces distortion.