| Columns Retired Columns & Blogs |
What's Going On Up There?
A much-touted benefit of DVD-Audio and Super Audio CD is that these new media can store digital audio data extending one or more octaves higher in frequency response than the capabilities of the CD. In the August issue's "Industry Update" (pp.27-29), Paul Messenger reported on an add-on supertweeter from English manufacturer Tannoy that would extend the ultrasonic response of loudspeakers so they can reproduce this new information. Putting to one side for now the issue of whether a loudspeaker really needs to be able to reproduce frequencies that no one can hear, the subject of how much ultrasonic content is present in real musical signals is still a contentious one.
Footnote 1: Most recently in his "Digital Audio for the Future" article, in the March 1998 issue of the now-defunct Audio.
Some Internet newsgroup jockeys have been insisting that, with a few exceptions—such as when instruments are miked very closely—the 44.1kHz CD sample rate is quite sufficient to capture everything that exists in live music. Even then, the outputs of almost all pro-audio microphones, particularly if they use large (1") diaphragms, drop like stones above 20kHz. Other experts, such as Bob Meridian's Stuart, have stated (footnote 1) the need for a digital system with a signal bandwidth at least half an octave higher than the 22.05kHz or 24kHz routinely used in CD production. (Remember that sampling theory shows that sounds with frequencies up to but not including half the sample rate are captured perfectly.)
As I had been using the inexpensive CoolEdit 2000 digital audio workstation PC software (available for $69 from Syntrillium to prepare the September issue's review of the CardDeluxe PC soundcard, I used it to analyze some of the high-sample-rate recordings I have made. (The $595 CardDeluxe can record and replay at sample rates of up to 96kHz with a 24-bit word length.) In the following spectrograms, the vertical axis is frequency, extending up to 44.1kHz or 48kHz, depending on the sample rate of the original WAV file; the horizontal axis is time; and the color of the spectral components corresponds to amplitude, with white then yellow being the highest in level, dark blue then black the lowest. I have added a horizontal red marker to the right of each graph to indicate the CD's 22.05kHz upper limit.
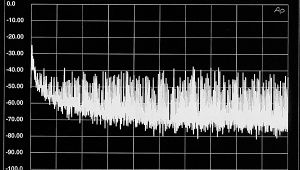
In his August "Update" piece, Paul Messenger mentioned the work of Caltech educator and classical pianist James Boyk, specifically his paper "There's Life Above 20kHz—A Survey of Musical Instrument Spectra to 102.4kHz." One of the instruments Boyk has mentioned as having an extended ultrasonic spectrum is the trumpet when played with a Harmon mute. Fig.1 shows a spectrogram of this instrument, recorded at a sample rate of 96kHz. The flecked nature of the darkest regions of this graph is due to noise. Because of the relatively distant miking, the original was way down in level; I normalized it for this analysis. While the highest-level spectral components (white, yellow, orange) are all relatively low in frequency (below 15kHz), you can see red and pink lines extending out beyond 30kHz.
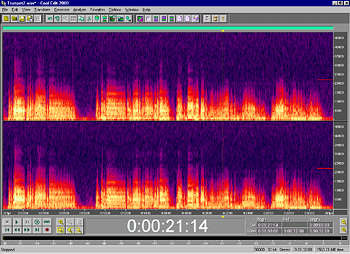
Fig.1 Spectrogram of trumpet playing with a Harmon mute. Master data recorded at 24 bits and 96kHz sample rate.
Fig.2 shows an FFT-derived spectrum of one of these bursts of ultrasonic energy: The highest-level component of the trumpet sound lies at 4.9kHz (A), at -16dBFS. There is a 21.8kHz component at -74dBFS (B), which would be only just preserved with a 44.1kHz or 48kHz sample rate. But a recognizable 34kHz component at -95dB (C) would be lost. (If this all sounds very low in level, remember that the normalized waveform peaks at 0dBFS but because of its spikey nature, the individual harmonic components are all very much lower than 0dBFS.)
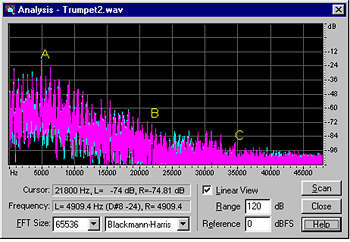
Fig.2 FFT-derived spectrum of extract from fig.1 data, 0Hz-48kHz (linear frequency scale, 12dB/vertical div., left channel cyan, right channel magenta).
How about orchestral music? Fig.3 shows a spectrogram of a large orchestra performing some lushly orchestrated film music, again recorded at 96kHz with relatively distant mikes. (My thanks to Stephen Lee of Canorus for this sample.) Note again that the bulk of the energy lies below 15kHz. You can also see that, most of the time, a 24kHz recorded bandwidth would capture the vast majority of musical energy. However, significant content exists out to beyond 30kHz at climaxes, mainly due to brass and percussion instruments.
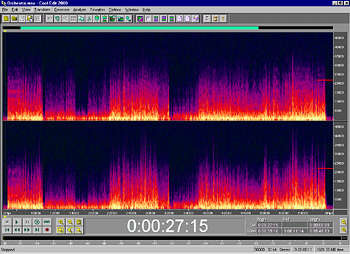
Fig.3 Spectrogram of full orchestra. Master data recorded at 24 bits and 96kHz sample rate.
To my surprise, close-miked electric music also has quite a lot of energy above the CD's hard limit of 22.05kHz. I recorded blues guitarist Jimmy D. Lane at the 1999 High-End Hi-Fi Show in Chicago, taking a feed from the PA mixing console (footnote 2). The sample rate was 88.2kHz. If you look closely at fig.4, which documents a few minutes from an intense slow blues, you can see a pretty uniform spectral content up to 8kHz, with serious energy still present up to twice that frequency. But note the red and pink lines in this graph, which extend all the way out to 40kHz.
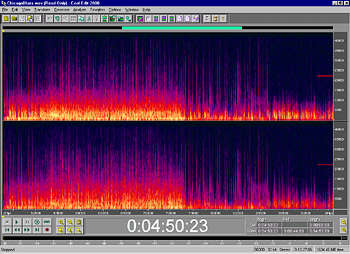
Fig.4 Spectrogram of extract from Jimmy D. Lane's "Salina Kansas Blues." Master data recorded live at HI-FI '99 at 24 bits and 88.2kHz sample rate.
Footnote 1: Most recently in his "Digital Audio for the Future" article, in the March 1998 issue of the now-defunct Audio.
NEXT: Page 2 »
|
| |||||||||
- Log in or register to post comments


| Loudspeakers Amplification Digital Sources | Analog Sources Accessories Featured | Music Columns Retired Columns | Show Reports | Features Latest News Community | Resources Subscriptions |
 © 2024 Stereophile
AVTech Media Americas Inc., USA
All rights reserved

