This series of articles is based on a paper presented at the 103rd Audio Engineering Society Convention, New York, September 1997. The preprint, "Loudspeakers: What Measurements Can Tell Us—And What They Can't Tell Us!," AES Preprint 4608, is available from the AES, 60 East 42nd Street, Room 2520, New York, NY 10165-0075. The AES internet site, www.aes.org, offers a secure transaction page for credit-card orders. In the first two articles in this series, I examined the loudspeaker's electrical behavior and how it behaves in the time domain. But the on-axis amplitude response is the most commonly seen loudspeaker measurement and the one that most people assume best correlates with sound quality. Whether it does or not will be examined in this final article. There's only one method to assess a speaker's "frequency response" with complete accuracy from 20Hz upward: using a very slowly swept sinewave in a large anechoic chamber. This is a room where sound-absorbing materials on every surface soak up every sound emitted by the speaker. The room is therefore removed from the picture and the only sound that reaches the measuring microphone is therefore that from the speaker. Anechoic chambers are expensive, both in terms of real estate and in their construction, so those of us with limited budgets have to look elsewhere. Three testing strategies can be adopted: LMS (gated toneburst), TEF (swept sinewave with time-delayed swept bandpass filter), and MLS (Maximum Length Sequence) testing. All of these methods allow a loudspeaker's anechoic response to be assessed, after a fashion, in a real room. All my measurements for Stereophile are done using the MLS technique, using a commercial instrument, the DRA Labs MLSSA system, a combination of a full-length PC card and a DOS program running on a PC.
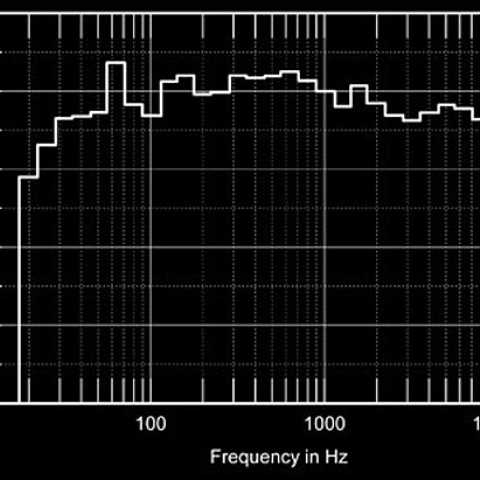
To examine a loudspeaker's anechoic amplitude response at one point in space, you first capture or calculate its impulse response. The impulse response carries almost all the information to describe the speaker's behavior. (It doesn't describe the speaker's nonlinear behavior, so it must be remembered that all quasi-anechoic frequency-response measurements assume the speaker being tested produces zero distortion—which is never true!) That impulse response is windowed to eliminate room-boundary reflections in the impulse tail. Then, using the Fast (Discrete) Fourier Transform [52], those time-domain data can be transformed into frequency-domain information—see the sidebar on the Fast Fourier Transform that accompanied the second article in this series (Stereophile, December 1998, p.85). However, there are a number of things to consider, some practical, some theoretical. And there is also the issue of repeatability vs. absolute accuracy. My first goal in establishing a loudspeaker measurement regime at Stereophile was to be able to reliably produce repeatable measurements. Standardization of techniques and rigor applied to setup is important here. I routinely measure the same sample speakers at regular intervals (a year or so). The measured response is effectively unchanged, meaning that this goal of internal consistency has been achieved. Absolute accuracy is more difficult to achieve and, in a sense, is a never-ending quest. However, when I have been able to compare my measurements of loudspeakers with those of reviewers for other magazines or with those of manufacturers, there is generally a good correspondence, taking into consideration different samples, microphones, techniques, and test conditions. It is obvious that we are all measuring the same model. The first practical aspect of performing the measurement is the microphone used. For economic reasons—my measuring microphone has to double as a recording microphone—I use a B&K Type 4006, ½", phantom-powered omnidirectional microphone. While it has a very flat amplitude response for a recording microphone, its on-axis response still varies by +2.1dB, -1.5dB between 1kHz and 20kHz [53]. In 1991 it was compared in an anechoic chamber against a B&K instrumentation microphone to generate a response error curve (fig.22, top trace). As long as I always use the same measurement distance and the same microphone axis, it is reasonable to subtract the microphone's amplitude error data from a loudspeaker's measured response. However, I don't compensate for the microphone's phase response, meaning that there's always just a little bit of error in my published phase measurements. But as I said in the second article in this series, I hardly ever find a speaker that has a good enough time response to make it worth showing. The lower trace in fig.22 shows the response error of an inexpensive measuring microphone from Old Colony Sound Lab, the Mitey Mike II (footnote 1), that I have also been using for the past year or so. Designed by Joe D'Appolito and using a small omnidirectional back-electret capsule from Panasonic, the MM II is significantly flatter in response than the B&K.
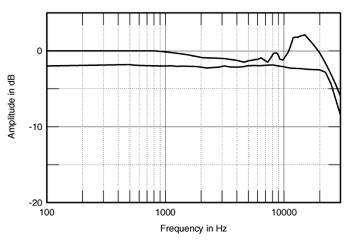 Fig.22 On-axis response of B&K 4006 omnidirectional microphone used for Stereophile loudspeaker reviews since 1989 (top). Response of Mitey Mike II also used for reviews since 1997 (bottom).
Footnote 1: Described in full in the Four/97 issue of Speaker Builder, the Mitey Mike II is available calibrated or uncalibrated, with either a pre-assembled or a DIY head amplifier from Old Colony Sound Lab, P.O. Box 576, Peterborough, NH 03458. Tel: (603) 924-6371. Fax: (603) 924-9467.
Fig.22 On-axis response of B&K 4006 omnidirectional microphone used for Stereophile loudspeaker reviews since 1989 (top). Response of Mitey Mike II also used for reviews since 1997 (bottom). Footnote 1: Described in full in the Four/97 issue of Speaker Builder, the Mitey Mike II is available calibrated or uncalibrated, with either a pre-assembled or a DIY head amplifier from Old Colony Sound Lab, P.O. Box 576, Peterborough, NH 03458. Tel: (603) 924-6371. Fax: (603) 924-9467.