Zesto Leto Ultra II line preamplifier Measurements

Sidebar 3: Measurements

The Zesto Leto Ultra II looks identical to the original Leto preamplifier that the late Robert J. Reina reviewed in April 2014, although its two 12AX7 tubes have been replaced by 12DW7s. (The Ultra II also has two 12AU7 tubes.) The manual warns against installing the tubes incorrectly, so I made sure that I inserted each tube in its correct socket and, once that was done, I measured the Leto Ultra II's performance with my Audio Precision SYS2722 system (see the January 2008 "As We See It"). There are three gain settings; the manual says to use the setting that allows you to use the volume control close to its 12 o'clock position. The maximum gain in the nominal 3dB setting was 3.95dB, balanced input to balanced output, and 2.83dB, unbalanced input to unbalanced output. With the nominal 6dB setting, the maximum gains were 7.5dB and 6.4dB, respectively, and with the 9dB setting, the gains were 11.5dB and 10.95dB. Even at the highest setting, the maximum gain is lower than that of the original Leto preamplifier. Both sets of inputs and outputs preserved absolute polarity (ie, were noninverting), the XLRs being wired with pin 2 hot.

The unbalanced input impedance is specified as 100k ohms. I measured 44k ohms at 20Hz and 1kHz, dropping slightly to 38k ohms at 20kHz—lower but still high. The transformer-coupled balanced input impedances were lower than the unbalanced, at close to 9k ohms across the audioband, which is slightly and inconsequentially lower than the specified 10k ohms. Both the balanced and unbalanced output impedances were a low 100 ohms at 20Hz and 1kHz, rising to a still-low 163 ohms at 20kHz.

The unbalanced frequency response started to roll off at the top of the audioband, reaching –1dB at 20kHz into 100k ohms (fig.1, blue and red traces). The top-octave rolloff started a little earlier into 600 ohms (cyan and magenta traces). Note the superb matching between the channels in this graph. This graph was taken with the gain set to 9dB and the volume control set to its maximum. The channel matching and the frequency response were the same at lower settings of the volume control and at the other two gain settings.

121zestofig01

Fig.1 Zesto Leto Ultra II, unbalanced frequency response at 1V, with 9dB gain and volume control set to maximum, into 100k ohms (left channel blue, right red), and 600 ohms (left cyan, right magenta) (1dB/vertical div.).

The balanced frequency response is shown in fig.2. The output at 20kHz is a little higher than in fig.1, but the ultimate ultrasonic rolloff is faster. From right to left, the traces in fig.3 show the unbalanced response with the Presence control set to 0 (as it had been in figs.1 and 2), –1, –2, –3, –4, and –5. The –3dB frequency successively moves down from 39kHz to 12kHz, 10kHz, 5kHz, 2.3kHz, and 1.1kHz. These are close to the specified actions of the control, but other than Presence settings –1 and –2, these actions seem a little too extreme to be of practical use.

121zestofig02

Fig.2 Zesto Leto Ultra II, balanced frequency response at 1V, with 9dB gain and volume control set to maximum, into 100k ohms (left channel blue, right red), and 600 ohms (left cyan, right magenta) (1dB/vertical div.).

121zestofig03

Fig.3 Zesto Leto Ultra II, unbalanced frequency response at 1V, with 9dB gain and volume control set to maximum, into 100k ohms with, from right to left, Presence control set to 0, –1, –2, –3, –4, and –5 (left channel blue, right red) (2dB/vertical div.).

The Leto Ultra II's channel separation was very good, at >90dB between 300Hz and 5kHz, reducing to 70dB at 20kHz. The Leto Ultra II was also very quiet. Even with the volume control set to its maximum and the gain set to 9dB, the wideband, unweighted signal/noise ratio, ref. 1V output with the unbalanced input shorted, was good, at 71.7dB (average of both channels). This ratio improved to an excellent 89.8dB when the measurement bandwidth was restricted to the audioband, and to 92.5dB when I switched an A-weighting filter into the circuit. The wideband, unweighted ratios were the same with the 6dB and 3dB gain settings, but the audioband and A-weighted ratios each increased by 3dB when the gain was reduced by the same 3dB. This can be seen in fig.4, which shows the low-frequency spectra of the Zesto's unbalanced noise floor with the gain set to 3dB (blue and red traces) and to 9dB (cyan, magenta) while it reproduced a 1kHz tone at 1V into 100k ohms. Some very low-level harmonics of the AC supply frequency can be seen in both channels, but these all lie close to –110dB (0.0003%) and will be inconsequential.

121zestofig04

Fig.4 Zesto Leto Ultra II, unbalanced output spectrum of 1kHz sinewave, DC–1kHz, at 1V into 100k ohms, with gain set to 3dB (left channel blue, right red) and 9dB (left green, right gray) (linear frequency scale).

Fig.5 plots the THD+noise percentage against the Ultra II's unbalanced output voltage into 100k ohms. The distortion slowly rises above 300mV, reaching 0.1% at 2V RMS. With clipping defined as when the THD+N reaches 1%, the single-ended output clipped at 12V into 100k ohms. The unbalanced output clipped at 9.5V into the punishing 600 ohm load (fig.6), but this is well above the level needed to drive a power amplifier into overload. The balanced output also clipped at 12.5V into 100k ohms (fig.7). The output transformers don't limit the Leto Ultra II's output current.

121zestofig05

Fig.5 Zesto Leto Ultra II, unbalanced distortion (%) vs 1kHz output voltage into 100k ohms.

121zestofig06

Fig.6 Zesto Leto Ultra II, unbalanced distortion (%) vs 1kHz output voltage into 600 ohms.

121zestofig07

Fig.7 Zesto Leto Ultra II, balanced distortion (%) vs 1kHz output voltage into 100k ohms.

I examined how the THD+N percentage changed with frequency at an output level of 2V, which is sufficiently high to ensure that I was measuring distortion rather than noise. Into 100k ohms (fig.8, blue and red traces), the distortion rises slightly above 0.1% at low and high frequencies, but I don't think this implies any problem. I was surprised to find that the distortion was lower when I reduced the load impedance to 600 ohms (cyan and magenta traces).

121zestofig08

Fig.8 Zesto Leto Ultra II, unbalanced THD+N (%) vs frequency at 2V into 100k ohms (left channel blue, right red) and 600 ohms (left cyan, right magenta) (linear frequency scale).

The distortion in the unbalanced output at 1V into 100k ohms was primarily the second harmonic at –66dB (0.05%, fig.9), which would be subjectively innocuous even at higher levels. At the same 1V level into 600 ohms (fig.10), the second harmonic dropped to –70dB (0.03%), but the third harmonic was a little higher than it had been into the higher impedance. The third harmonic also made an appearance in the balanced output spectrum (fig.11), but it was 20dB lower than the second harmonic.

121zestofig09

Fig.9 Zesto Leto Ultra II, unbalanced spectrum of 50Hz sinewave, DC–1kHz, at 1V into 100k ohms (left channel blue, right red) (linear frequency scale).

121zestofig10

Fig.10 Zesto Leto Ultra II, unbalanced spectrum of 50Hz sinewave, DC–1kHz, at 1V into 600 ohms (left channel blue, right red) (linear frequency scale).

121zestofig11

Fig.11 Zesto Leto Ultra II, balanced spectrum of 50Hz sinewave, DC–1kHz, at 1V into 100k ohms (left channel blue, right red) (linear frequency scale).

Intermodulation distortion (fig.12) was very low in level, the second-order difference product at 1kHz with an equal mix of 19kHz and 20kHz tones lying close to –80dB (0.01%). Higher-order intermodulation products were negligible.

121zestofig12

Fig.12 Zesto Leto Ultra II, unbalanced HF intermodulation spectrum, DC–30kHz, 19+20kHz at 1V into 100k ohms (left channel blue, right red) (linear frequency scale).

Zesto's Leto Ultra II offers measured performance that is excellent—and better than that of the company's 2014 Leto.—John Atkinson

COMPANY INFO
Zesto Audio
3138 Calle Estepa
Thousand Oaks, CA 91360
(805) 807-1841
ARTICLE CONTENTS

COMMENTS
mememe2's picture

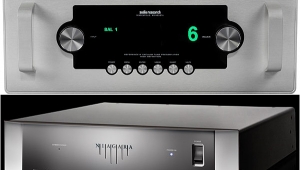
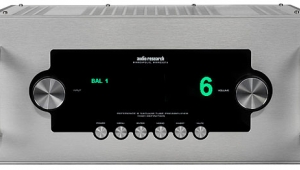
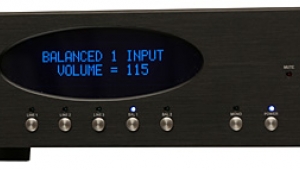
The preamp costs 11K US. "A small, nine-button plastic remote handles input, volume, "Presence," mute, mono, and gain." Why do so many costly upscale bits of hi end equipment come with cheap remotes? Is this one even backlit? It always reflects negatively on the perceived value of a component. You don't get faux leather seats in an upscale Honda.

Ortofan's picture

... line-level preamp in perspective is to consider that, for essentially the same price, one could buy both the Luxman CL-38uC preamp and the matching MQ-88uC power amp or the McIntosh C22 preamp and the MC275 power amp.
Both preamps include phono stages that can accommodate MM and MC cartridges.
KM should do a review of either one or both combos in comparison to his Shindo set-up.

https://luxmanamerica.com/product/cl-38uc/
https://luxmanamerica.com/product/mq-88uc/

https://www.mcintoshlabs.com/products/preamplifiers/C22-Mk-V
https://www.mcintoshlabs.com/products/amplifiers/MC275B

mosfet50's picture

I don't get it. I have been buying and using very sophisticated electronic equipment for decades and I never once had a manufacturer say you have to run it 200 hours before it works right. Not only does this equipment cost more than a lot of audio equipment but it goes down to levels well below human hearing.
This is why I want DBT. I want someone to prove that they can hear the difference in two pieces of audio equipment (except speakers) comparing out of the box to run 100 hours. I want people to prove they can hear the difference in cables in a DBT too. So far no one has been able to.

windansea's picture

I like the subjective opinions, but it should be backed up with some DBT. Trust but verify. If the $10K pre can't be distinguished from the $1K pre, from a pro reviewer with golden ears, then why spend the money?

X