| Columns Retired Columns & Blogs |

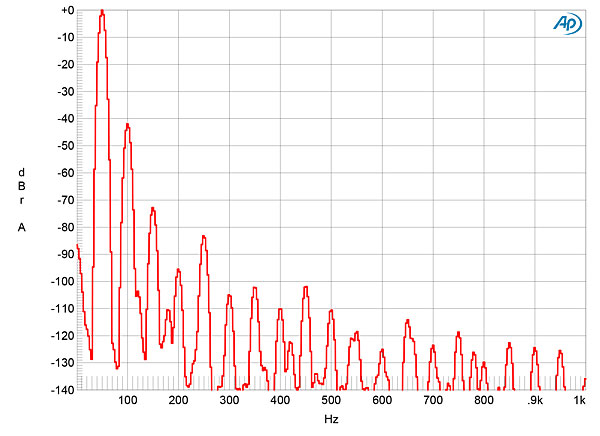
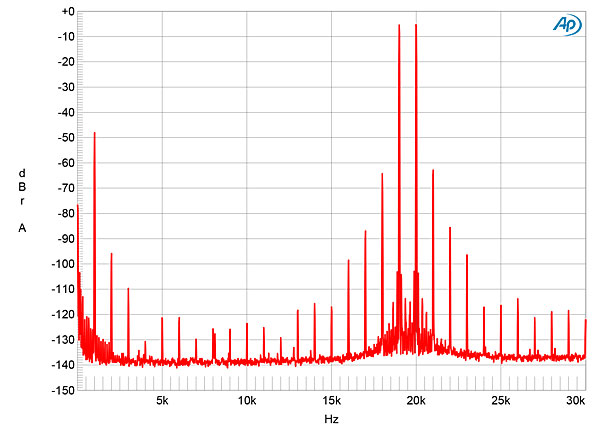

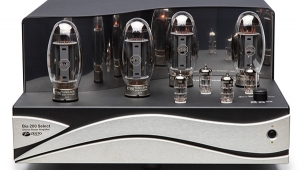
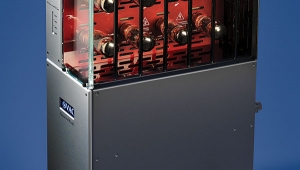
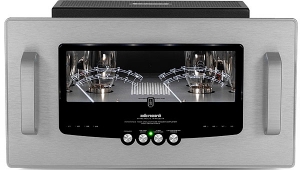
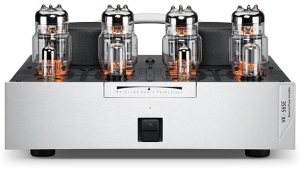
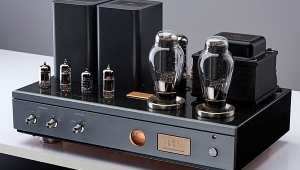
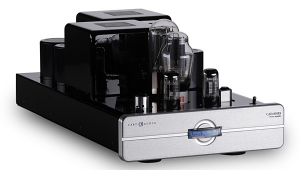
Now I've seen everything- A tube rectifier in a SS behemoth. Tube rectifiers are loved by guitarists for the sag they exhibit, something I assume would not be welcomed in a SS audio amp. Feel free to correct me if I'm wrong, and explain to me why.