| Columns Retired Columns & Blogs |
Wilson Audio Specialties MAXX loudspeaker Measurements part 3
I donned earplugs and moved to a louder, 100dB continuous level. From 30Hz to 100Hz the distortion average was still -50dB. Excellent! In the upper range, third harmonic remained tidy, averaging -56dB. While second harmonic was a little greater, it was very fair at, typically, -43dB, or almost 0.7%.
Leaving the upper range safe from overload, I drove the bass system to the practical power limit. At 106dB it still averaged 1% of second harmonic and 0.3% of third, both down to 30Hz. At 25Hz I got -32dB (2.4%) of second harmonic and -26dB of third (5%)—only just audible at this low frequency. A true power sinewave of 140W—equivalent to full-power orchestral bass—was sustained at 30Hz and remained tolerably pure.
Taken overall, the distortion performance was exceptionally good over the entire bandwidth. Dynamic range and dynamic linearity met the high expectations for a speaker of this engineering profile and price.
The physical structure is so well controlled that checks using an accelerometer revealed little of interest in terms of cabinet vibration. There was negligible coloration from this source.
The MAXX's step response (fig.8) was complicated by the 17kHz treble peak, which intruded at the start. Due to the delay paths to the microphone, not too much I should be read into this graph. Above 300Hz, the speaker's output had low phase shift with frequency. For the broadband energy/time response, both the unweighted (fig.9) and the Blackman/Harris weighted results (fig.10) were impressive for uniformity of decay rate, though I suspect the residual output from the bass system in the lower treble will slow the visible decay rate.
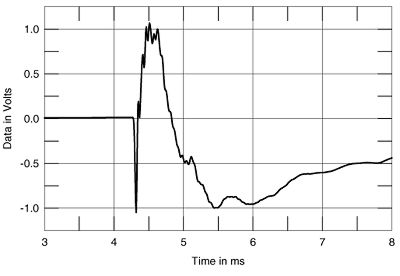
Fig.8 Wilson MAXX, step response on tweeter axis at 1.4m (5ms time window, 20kHz bandwidth).
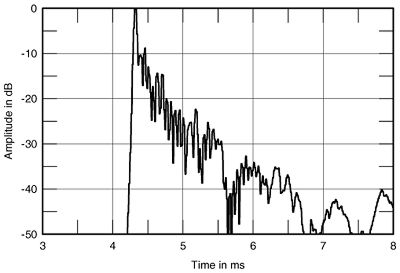
Fig.9 Wilson MAXX, Energy-Time Curve on tweeter axis, unwindowed (5ms time window).
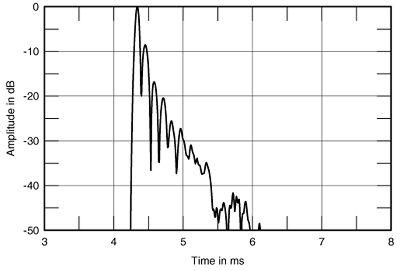
Fig.10 Wilson MAXX, Energy-Time Curve on tweeter axis, windowed with Blackman/Harris function (5ms time window).
For longer-term decay behavior, the waterfall graph using 10dB/div. scaling and 0.2ms decay filtering (fig.11) showed a complex field due to the driver overlap, but with no dominant features save the nearly inaudible treble resonance at 17kHz (the clean "ridge" visible in this graph). A good idea of the MAXX's transient attack is given by fig.12, which shows good phase integrity from 500Hz to 16kHz, and fast leading-edge decay. This fine performance was borne out by the listening tests.—Martin Colloms
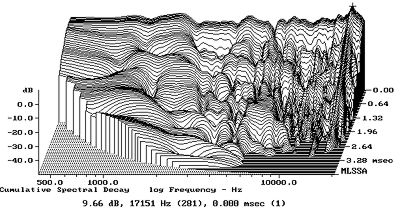
Fig.11 Wilson MAXX, cumulative spectral-decay plot at 50" (0.2ms risetime).
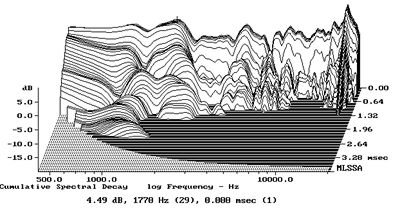
Fig.12 Wilson MAXX, cumulative spectral-decay plot at 50" (0.1ms risetime).
- Log in or register to post comments

