| Columns Retired Columns & Blogs |
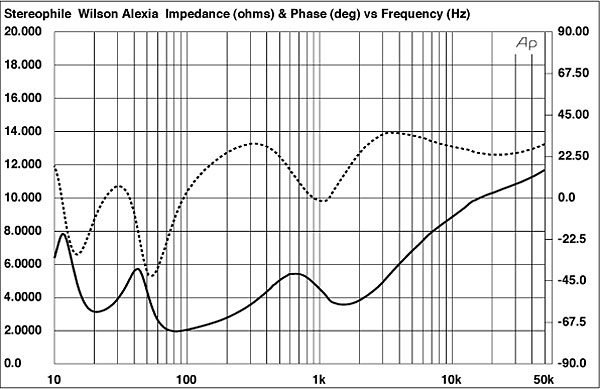


Really, no comments? Last year when the 200K Wilson's were reviewed, the comments section went crazy! So many people (who had never heard the Wilsons) were angry and torched the product. Some judged the speakers only on the measurements... And, they went ballistic!
No measurements were done for this review. Also, no comments. What a difference a year makes!