| Columns Retired Columns & Blogs |
Wadia 2000 Decoding Computer Measurements
Sidebar 3: Measurements
The first sample of the Wadia 2000 Digital Decoding Computer was bench-tested before shipment to Arnis Balgalvis for review. I measured extraordinarily poor low-level linearity, clearly indicating a malfunctioning unit. When the DAC board was returned to Wadia, they discovered that the linearity adjustments (a small hex-bolt on each DAC) had apparently worked themselves loose in transit. Wadia realigned the DACs and returned the board.
One can verify that the alignment screws are in their factory-set positions by looking at the drop of red sealant on the screw. If it appears unbroken, the DACs should still be factory-aligned for optimum linearity. I should add that the first sample had been shipped back and forth over the country several times, increasing the chance of misaligned DACs. This is a good example of the need to measure review products before subjective evaluation: AB could have performed the review on a unit that was not representative.
Before sending the newly aligned 2000 to AB, I performed both technical and subjective evaluations of the unit. The disparity between the Wadia 2000's stunning sonic characteristics and what turned out to be a relatively poor performance on the bench provided some interesting food for thought. I can only conclude that typical CD-player and decoder measurements reveal little about their intrinsic musicality. These measurements, however, are useful in determining if a unit is functioning correctly, if a device has any severe problems that would be audible, and also at least provide data when attempting to correlate measurements with subjective performance. The Wadia 2000 epitomizes the paradox of a device whose objective measurements would indicate less-than-state-of-the-art performance, but whose musical characteristics are clearly extraordinary. That said, here are the test results. (All measurements were performed after the Wadia 2000 had a full day of warmup, and signals were taken from the balanced outputs.)
The frequency-response graph of fig.1 showed a rapid rolloff starting at 10kHz, being down nearly 3dB at 20kHz. The dotted trace is the right channel. Typically, CD players and decoders have less than 0.5dB rolloff at 20kHz. Fig.2 shows the 2000's frequency response with the deemphasis circuitry engaged. It differs very little from fig.1, indicating minimal deemphasis error apart from the HF rolloff. The apparently different shape of the rolloff is a result of the different measurement technique used. Unemphasized frequency response is performed with a swept signal, while frequency response with deemphasis is performed at discrete frequencies (125Hz, 1kHz, 4kHz, 10kHz, 16kHz).
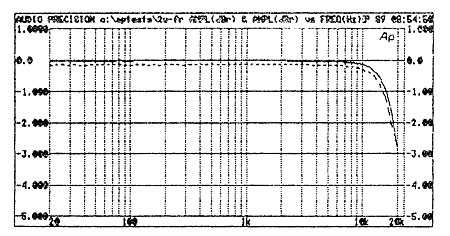
Fig.1 Wadia 2000, balanced frequency response at –12dBFS into 100k ohms (right channel dashed, 0.5dB/vertical div.).
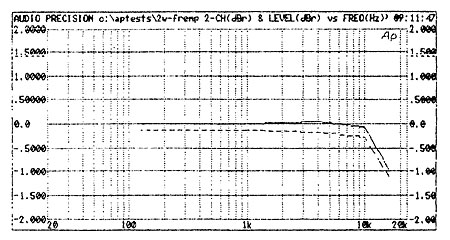
Fig.2 Wadia 2000, de-emphasis error (right channel dashed, 0.5dB/vertical div.).
The Audio Precision System One's interchannel phase test reveals relative phase shift between channels as a function of frequency. The Wadia's performance was excellent in this regard, with less than 0.5° shift at 10kHz. This would be expected from a digital decoder lacking analog brickwall output filters. Channel separation was also very good, with left-to-right crosstalk measuring –105dB across the band and right-to-left crosstalk –110dB across the band. There was a slight, though inconsequential, rise in crosstalk above 10kHz.
Playing the dithered 1kHz –90dB tone from the CBS test CD and analyzing the spectral output of the 2000 showed a slightly higher level of spuriae than is typical of other high-quality decoders (fig.3). In addition, a slight peak in the left-channel spectrum can be seen at 60Hz, the AC powerline frequency. However, it is nearly 120dB down from the unit's full output level. Because Martin Colloms measured a high level of ultrasonic spuriae from the Wadia 1000 (Vol.12 No.9), I extended the frequency range of this test to 200kHz. No evidence of ultra-high-frequency spuriae was seen. The graph also confirms the low-level linearity measurements performed later. The –90dB 1kHz tone can be seen to rise above the –90dB horizontal division.
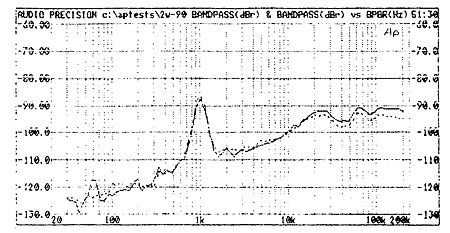
Fig.3 Wadia 2000, 1/3-octave spectrum with noise and spuriae of dithered 1kHz tone at –90dBFS with 16-bit CD data (right channel dashed).
The most interesting aspect of the Wadia 2000's measured performance was its linearity. Linearity measurements reveal the difference in the player or decoder's output level and the actual level encoded on the test disc. Low-level linearity has been considered of paramount importance in subjectively successful digital decoding. I was therefore surprised to see the results of the linearity tests after I had heard the remarkable sonic performance of the Wadia 2000. Figs.4 and 5, respectively, show left- and right-channel deviation from perfect linearity. Not only was the error large in each case, but it began deviating at a relatively high level. Typically, the linearity of a subjectively good CD player will remain perfect until about –80dB, below which the DACs lose precision. That the Wadia's linearity should deviate at the –60dB level was indeed a surprise and implies a slight degree of compression of low-level audio information.
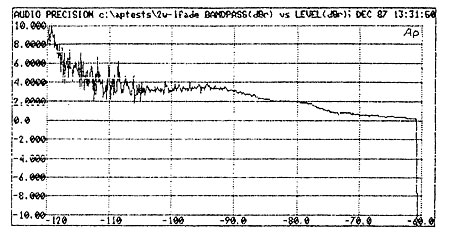
Fig.4 Wadia 2000, left-channel departure from linearity, 16-bit data (2dB/vertical div.).
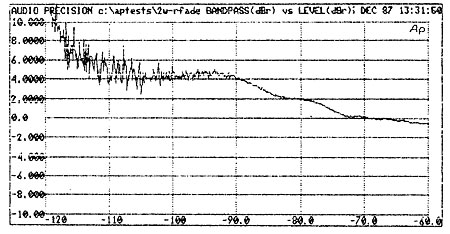
Fig.5 Wadia 2000, right-channel departure from linearity, 16-bit data (2dB/vertical div.).
The "Fade to Noise with Dither" track on the CBS test disc is a 500Hz signal whose envelope varies continuously from –60dB to –120dB over a period of 30 seconds. When reproduced by a decoder, its output should maintain the same amplitude slope over time. Any variation is revealed as a departure from a perfectly straight line on the graph. The fade-to-noise plot of the 2000's left channel is shown in fig.6 (the right channel was similar). Though less S-shaped than the Wadia 1000 measured by Martin last September, again, this performance is far from ideal. For comparison, fig.7 shows the fade-to-noise of the first, faulty sample.
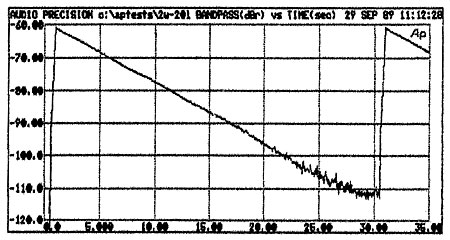
Fig.6 Wadia 2000, left-channel fade-to-noise with dither, 16-bit data (2dB/vertical div.).
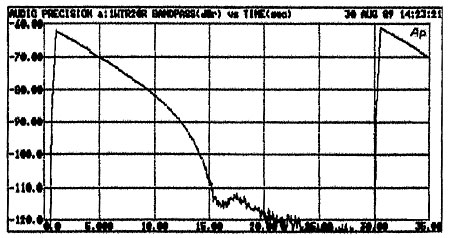
Fig.7 Wadia 2000, original sample, right-channel fade-to-noise with dither, 16-bit data (2dB/vertical div.).
After measuring the Wadia 2000's linearity, I connected it to the system in DO's listening room and tried to hear any low-level anomalies imparted by its linearity deviation. I could hear none. Instead, I heard a greater sense of depth, detail, nuance, and resolution in reverb decay than I have ever heard from digital playback. All these subjective impressions should, at least theoretically, be affected by low-level linearity performance. That there was no correlation, but in fact an inverse correlation, is intriguing. I have in mind a blind test in which I deliberately misalign a converter's linearity and ask a panel of listeners for subjective reactions at varying levels of linearity error. Stay tuned.
If the Wadia 2000's measurements were allowed to speak for themselves, the product would appear to be mediocre at best. This is a classic example of the need to judge a product by listening, not by reading the specifications.—Robert Harley
NEXT: JA Measures (& Listens) »
|
|
| ||||||||||
- Log in or register to post comments


| Loudspeakers Amplification Digital Sources | Analog Sources Accessories Featured | Music Columns Retired Columns | Show Reports | Features Latest News Community | Resources Subscriptions |
 © 2024 Stereophile
AVTech Media Americas Inc., USA
All rights reserved

