| Columns Retired Columns & Blogs |
Tannoy E11 loudspeaker Measurements
Sidebar 2: Measurements
Driving the E11s with a sinewave oscillator revealed minor cabinet resonances at 30Hz and 90Hz. At 200Hz, the cabinet started to vibrate and take on a buzzing sound. At 220Hz, the buzzing produced by the cabinet was louder than the tone produced by the woofer. This will certainly be audible as an inability to distinguish the pitch of notes near this area. Another lower-amplitude resonance was heard at 380Hz.
Fig.1 shows the E11's impedance magnitude and phase angle. The impedance is quite high, dropping to 6 ohms in the lower treble only over a narrow frequency band. This suggests that the E11 will be an easy load to drive even for inexpensive amplifiers. Given the fact that I found the cabinet to have a vibration problem at 220Hz, it is interesting to see that this shows up as a wrinkle in the impedance plot at the same frequency.
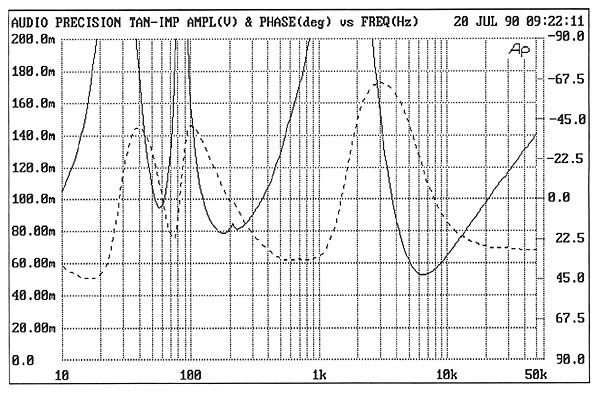
Fig.1 Tannoy E11, electrical impedance (solid) and phase (dashed) (2 ohms/vertical div.).
Moving to the E11's time-domain performance, the impulse response is shown in fig.2. This curve's shape is typical and somewhat cleaner than the Dana Model 1's impulse response. Mathematically converting the anechoic portion of the impulse response with the Fourier Transform yields the black frequency-response plot on the right of fig.3. (The frequency response shown is actually an average of five responses taken over a 30° lateral window.) The E11's nearfield woofer response, measured with the microphone capsule almost touching the dustcap, appears on the same graph as he blue trace below 300Hz. The rear-firing port's output is also plotted as red trace, centered on 58Hz, the tuning frequency suggested by the impedance minimum in fig.1. Below the port center frequency, where the woofer minimum is apparent, the woofer and port outputs are in opposite polarity, resulting in a steeper LF rolloff than the plot would suggest.
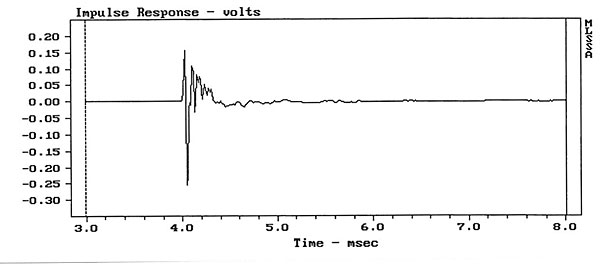
Fig.2 Tannoy E11, impulse response on tweeter axis at 48" (5ms time window, 30kHz bandwidth).
Most of the midband in fig.3 is fairly smooth, with a crossover-related suckout apparent at 3kHz. The crossover between the woofer (blue trace) and tweeter (green trace) occurs just below 4kHz. The treble rolls off above 15kHz before the tweeter resonance takes over at about 25kHz.
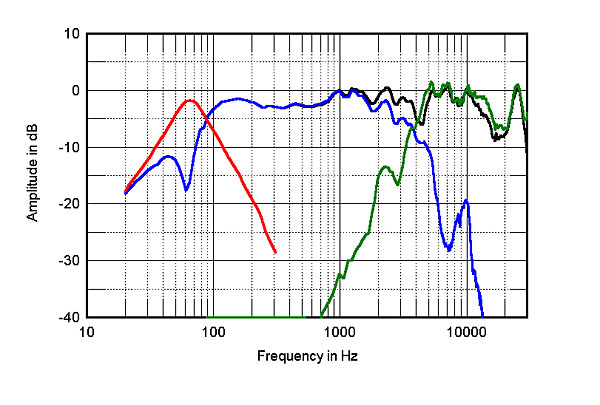
Fig.3 Tannoy E11, anechoic response on tweeter axis at 48", averaged across 30° horizontal window and corrected for microphone response, with: farfield tweeter response (green) and farfield woofer response (blue) on tweeter axis, with nearfield responses of woofer (blue) and port (red) plotted below 300Hz.
Fig.4 is the E11's Cumulative Spectral Decay plot, also known as a "waterfall" graph. There is a very clean and sudden initial decay, but the treble region has some "hashiness" to the response, evidenced by the dense dark area centered around 10kHz, but beginning at 6.5kHz. This perhaps correlates to my impression of a somewhat "steely" and "metallic" treble. Compare this plot with those of the Dana Model 1 and the NHT 1.3.—Robert Harley
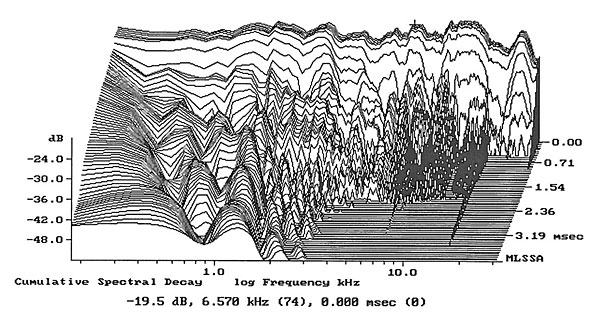
Fig.4 Tannoy E11, cumulative spectral-decay plot on tweeter axis at 48" (0.15ms risetime).
NEXT: Specifications »
|
| ||||||||||
- Log in or register to post comments


| Loudspeakers Amplification Digital Sources | Analog Sources Accessories Featured | Music Columns Retired Columns | Show Reports | Features Latest News Community | Resources Subscriptions |
 © 2024 Stereophile
AVTech Media Americas Inc., USA
All rights reserved

