| Columns Retired Columns & Blogs |
Sony ES SS-M9ED loudspeaker Measurements
Sidebar 3: Measurements
The big Sony's impedance (fig.1) stays within 4 and 6 ohms in the bass, most of the midrange, and the mid-treble. There is a large impedance peak in the upper midrange, due to the crossover between the midrange driver and the main tweeter, but the impedance drops above 8kHz, reaching a minimum value of 1.75 ohms at 22kHz. Fortunately, the electrical phase angle is low at this frequency, but there are a couple of regions where quite a high capacitive phase angle is coupled with a generally low magnitude. Around 10kHz, for example, you have 3.7 ohms coupled with around 42 degrees phase, while at 2.5kHz, you have more than 45 degrees of capacitive phase shift coupled with around 5 ohms of magnitude. High-current solid-state power amplifiers will work best with this speaker, or a high-quality tubed design with good, beefy 4 or 2 ohm output transformer taps.
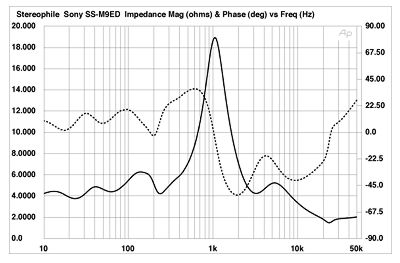
Fig.1 Sony ES SS-M9ED, electrical impedance (solid) and phase (dashed) (2 ohms/vertical div.).
There is only a small hint of the reflex alignment in the ES SS-M9ED's impedance plot, but the vestigial "saddle" in the magnitude plot between 22 and 28Hz indicates the tuning frequency of the ports. The traces in fig.1 are free from mechanical or air-space-resonance-induced wrinkles, and the constrained-layer-damped baffle and the braced and damped enclosure are indeed free from vibrational modes. Fig.2, for example, is a cumulative spectral-decay plot calculated from the output of a simple plastic-tape accelerometer fastened to the cabinet sidewall adjacent to the midrange unit. There is literally nothing to be seen!

Fig.2 Sony ES SS-M9ED, cumulative spectral-decay plot of accelerometer output fastened to side of enclosure 12" from top (MLS driving voltage to speaker, 7.55V; measurement bandwidth, 2kHz).
From right to left, fig.3 shows the nearfield responses of the midrange unit, woofers, and ports, adjusted in proportion to the square root of the radiating areas. The midrange/woofer crossover occurs, as specified, at 200Hz, with symmetrical fourth-order, 24dB/octave filter slopes. The woofers are basically flat within their passband, with the ports peaking just a little above the woofers' minimum-motion point of 26Hz. (At this frequency, the pressure on the backs of the woofer cones from the port resonance is sufficiently strong to hold the cones motionless.) Below that frequency, the ports and woofers all roll off with a 12dB/octave slope, but because the ports are out of phase with the woofers, the combined output rolls off at 24dB/octave.
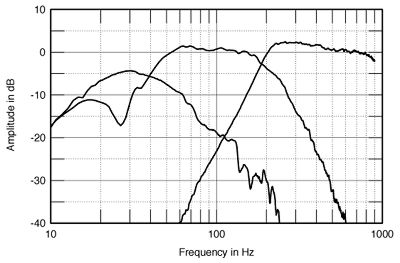
Fig.3 Sony ES SS-M9ED, low-frequency acoustic crossover, with nearfield midrange, woofer, and port responses.
This can be seen in fig.4, which shows the complex sum of the low-frequency nearfield responses (taking both phase and drive-unit path differences into account) and the farfield response on the main tweeter axis, averaged across a 30 degrees horizontal angle. The 6dB-down point of 28Hz is almost exactly the tuning frequency of the ports, and though the bass seems a little shelved-down—remember that this kind of measurement assumes a 2-pi environment for the LF units, which will result in a slightly elevated measured response for an anechoically flat bass alignment—the overall graph is astonishingly flat. Perhaps a very slight rising trend is apparent through the treble, though not nearly enough on its own to explain the lean balance I perceived in my listening room. The supertweeter appears to peak a little between 20 and 30kHz, but this is probably subjectively irrelevant. Sony claims that the supertweeter gives effective output to well above 50kHz, but I plot my response graphs up to only 30kHz, the effective upper band-limit of my ½" B&K mike.
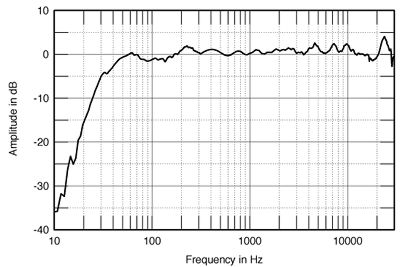
Fig.4 Sony ES SS-M9ED, anechoic response on tweeter axis at 50", averaged across 30 degrees horizontal window and corrected for microphone response, with complex sum of nearfield midrange, woofer, and port responses plotted below 300Hz.
The very slight upward tilt in the top two audio octaves can also be seen in the lateral-dispersion plot (fig.5). However, as is apparent from fig.6, which shows just the differences between the off-axis responses and that on the tweeter axis, the speaker becomes quite directional in the same region, which will ameliorate the subjective effect of the on-axis excess of energy. Note how evenly spaced the contour lines are in these two graphs, something that always correlates with stable, precise stereo imaging. However, fig.6 does reveal a slight flare at the bottom of the main tweeter's passband. This is partially due to an on-axis depression filling in to the speaker's sides. But all things being equal, this wider dispersion in the presence region, where the ear is most sensitive, might make the Sony sound, if not exactly bright in live rooms, then definitely balanced on the side of clarity and forwardness rather than reticence and distance. Couple this with the overdamped bass alignment, and I think this explains the ultimate lack of warmth I noted in the SS-M9ED's presentation.
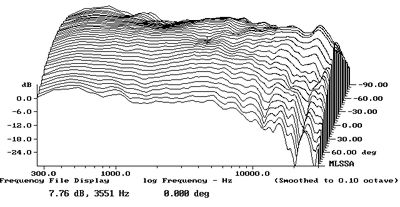
Fig.5 Sony ES SS-M9ED, horizontal response family at 50", from back to front: responses 90 degrees-5 degrees off-axis; reference response on tweeter axis; responses 5 degrees-90 degrees off-axis.

Fig.6 Sony ES SS-M9ED, horizontal response family at 50", normalized to response on tweeter axis, from back to front: differences in response 90 degrees-5 degrees off-axis; reference response; differences in response 5 degrees-90 degrees off-axis.
NEXT: Measurements part 2 »
|
|
| ||||||||||
- Log in or register to post comments


| Loudspeakers Amplification Digital Sources | Analog Sources Accessories Featured | Music Columns Retired Columns | Show Reports | Features Latest News Community | Resources Subscriptions |
 © 2024 Stereophile
AVTech Media Americas Inc., USA
All rights reserved

