Sonus Faber Amati Futura loudspeaker Measurements

Sidebar 3: Measurements

I used DRA Labs' MLSSA system and a calibrated DPA 4006 microphone to measure the Sonus Faber Amati Futura's frequency response in the farfield, and an Earthworks QTC-40 for the nearfield and spatially averaged room responses. As Sumiko's John Hunter had taken great pains to optimize the speakers' backtilt when he set them up in my room, I measured a single Amati Futura on the exact axis at which his setup had placed my ears. This was 2" below the tweeter at my standard 50" microphone distance. My estimate of the Amati Futura's voltage sensitivity on this axis was 88.1dB(B)/2.83V/m, a little lower than the specified 90dB though still slightly above average. However, the Sonus Faber's plot of impedance magnitude and phase (fig.1) indicates that the speaker is a fairly difficult load for the partnering amplifier to drive, with a magnitude dropping to 3 ohms and below in the lower midrange, and a combination of 4.6 ohms and –43° electrical phase angle at 51Hz. There is also a dip to 3.75 ohms at 5kHz, though the phase angle is close to 0° at this frequency.

The traces in fig.1 are almost free from the small wrinkles that would imply the presence of panel resonances, though there is a slight discontinuity just below 900Hz. When I investigated the enclosure's vibrational behavior with a plastic-tape accelerometer, I did find a resonant mode at 273Hz present on all surfaces (fig.2), but this was very low in level. The sophisticated mass-damping system used in the Amati Futura to suppress cabinet resonances seems to be effective.

Fig.1 Sonus Faber Amati Futura, electrical impedance (solid) and phase (dashed). (2 ohms/vertical div.)

Fig.2 Sonus Faber Amati Futura, cumulative spectral-decay plot calculated from output of accelerometer fastened to sidewall adjacent to midrange unit (MLS driving voltage to speaker, 7.55V; measurement bandwidth, 2kHz).

Turning to the responses of the individual drive-units, the black trace above 350Hz in fig.3 shows the farfield output of the midrange driver. This is spliced to the midrange unit's nearfield response at 350Hz, and it can be seen that this unit slowly rolls off in the lower midrange, reaching –6dB at 100Hz. There is a sharp notch in its output between 40 and 50Hz, suggesting that this is the tuning frequency of the topmost port, which loads the midrange unit. However, the port's nearfield response (fig.3, brown trace) starts to roll off below 70Hz, due to the high-pass filter in the midrange unit's feed. This port probably is used more to extend the unit's dynamic range than to augment its lower-frequency response. However, two sharply defined resonant peaks can be seen in this port's output, at 440 and 890Hz, the latter suspiciously close to the frequency of the slight discontinuity in the impedance traces. As these modes are of high Q (Quality Factor), they may well not be fully excited by music. Their audibility will also be reduced by the fact that this port faces to the speaker's rear—I didn't notice any coloration in my auditioning that could be placed at the feet of this behavior.

Fig.3 Sonus Faber Amati Futura, acoustic crossover on listening axis at 50", corrected for microphone response, with nearfield midrange unit (black trace), upper woofer (green), lower woofer (blue), upper port (brown), middle port (red), and bottom port (magenta) responses, respectively plotted below 350Hz, 1250Hz, 650Hz, 550Hz, 1kHz, 550Hz, and 500Hz.

The green and blue traces in fig.3 show the nearfield responses of the upper and lower woofers, respectively, and reveal that the lower is rolled off at a lower frequency than the upper, allowing the latter to cross over to the midrange unit alone. Both woofers are free from resonant modes above their passbands, and while both feature the usual reflex-loading minimum-motion notch in their low-frequency output, these are slightly different in frequency. The responses of the middle (red) and bottom (magenta) ports, which load the two woofers, are identical below 100Hz, their outputs peaking between 17 and 60Hz.

Fig.4 shows how these individual responses sum in the farfield, with the microphone on the listening axis. The rise in response below 200Hz is entirely due to the nearfield measurement technique, but a slight sloping-down trend is apparent from the midrange through the high treble. The trace is extremely smooth, however. This graph was taken with the grille removed; with the grille in place (not shown), there is actually a tad more mid-treble energy evident, though the top octave is now disturbed by narrow peaks and dips reaching ±1.5dB in amplitude.

Fig.4 Sonus Faber Amati Futura, anechoic response on listening axis at 50", averaged across 30° horizontal window and corrected for microphone response, with complex sum of nearfield responses plotted below 300Hz.

The Amati Futura's lateral dispersion (fig.5) is not as even as I like to see, with an off-axis trough developing at the top of the midrange unit's passband. This graph also reveals that the tweeter becomes quite directional above 8kHz or so, which will add to the slightly sloped-down response in fig.4 to give the mellow balance I noted in my auditioning. The vertical dispersion graph (fig.6) shows that a large suckout in the upper crossover region develops 5° and more above the listening axis; not shown in this graph is the fact that raising the microphone 2" to the tweeter axis increases the top-octave output by 0.5dB or so, though at the expense of mid-treble output.

Fig.5 Sonus Faber Amati Futura, lateral response family at 50", normalized to response on listening axis, from back to front: differences in response 90–5° off axis, reference response, differences in response 5–90° off axis.

Fig.6 Sonus Faber Amati Futura, vertical response family at 50", normalized to response on listening axis, from back to front: differences in response 15–5° above axis, reference response, differences in response 5–10° below axis.

The red trace in fig.7 shows the Sonus Faber's spatially averaged response in my listening room. I perform this measurement by averaging twenty 1/6-octave–smoothed responses taken for each speaker individually in a rectangular grid measuring 36" by 18" and centered on the positions of my ears in my listening chair. (I use an Earthworks omni microphone and a Metric Halo ULN-2 FireWire audio interface, in conjunction with SMUGSoftware's Fuzzmeasure 2.0 running on my Apple laptop.) The slight peaks and dips between 150 and 400Hz in this trace will be due to room effects not eliminated by the spatial averaging; above that region, the trace is remarkably smooth, though there is not as much energy above 8kHz in-room as with the Vivid B1 (blue trace), and much less treble energy overall than with the TAD CR1 (green trace). These graphs neatly sum up the high-frequency differences to be heard among these speakers in my room, with the Amati Futura definitely offering the mellowest balance. At the other end of the spectrum, the Sonus Faber offers full measured output down to 20Hz, with the TAD reaching 25Hz and the Vivid 35Hz, though all three speakers are helped by my room's diagonal resonant mode at 32Hz.

Fig.7 Sonus Faber Amati Futura, spatially averaged, 1/6-octave response in JA's listening room (red), and of TAD Compact Reference CR1 (green) and Vivid B1 (blue).

Turning to the time domain, the Amati Futura's step response on the listening axis (fig.8) suggests that John Hunter got it right: The smooth integration of the decay of each drive-unit's step into the start of that of the next lower in frequency confirms that this is indeed the optimum axis. However, this graph also reveals that the tweeter and midrange units are connected in inverted acoustic polarity, the woofers in positive polarity, this confirmed by looking at the individual steps (not shown). The Sonus Faber's cumulative spectral-decay plot (fig.9) indicates a very clean initial decay, though a little more very-low-level hash is present in the treble than I was anticipating.

Fig.8 Sonus Faber Amati Futura, step response on listening axis at 50" (5ms time window, 30kHz bandwidth).

Fig.9 Sonus Faber Amati Futura, cumulative spectral-decay plot on listening axis at 50" (0.15ms risetime).

Overall, Sonus Faber's Amati Futura offers respectable measured performance, with no significant areas of weakness.—John Atkinson

COMPANY INFO
Sonus Faber SPA
US distributor: Sumiko
2431 Fifth Street
Berkeley, CA 94710
(510) 843-4500
ARTICLE CONTENTS

COMMENTS
LyleHughes's picture

Nice review JA, I definitely agree with you on all points.

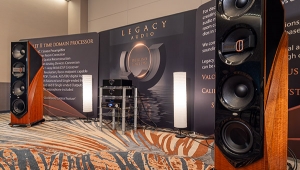
As someone who has been auditioning speakers for purchase the past few months, I wanted to share my results. I found the new Legacy AERIS speakers (about half the cost of the Amati Futura) outperformed the Amati Futura during my auditions- especially in several areas you mentioned.

First, the low frequencies- like you, found the Sonus Faber a little fluffy and lacking in low frequency dynamic impact. This was definitely an area where the Legacy excelled- incredibly deep, subterranean low end extension that is very tight and dynamic. I enjoyed the midrange clarity on both the sonus Faber and the Legacy, but I’d give the edge to Aeris- they were both magnificently detailed, though!

Dynamics wise, the Legacy took whatever I threw at it (hello life like transients!). The Sonus Faber couldn’t quite keep up with the Aeris, especially with the dynamic swings found in classical pieces.

Finally, the high frequencies- this is where the Legacy absolutely trounced the Sonus Faber. The newer Legacy AMT system is stunning- highs are airy and extend far beyond the Sonus Faber, while remaining clear. I believe this performance advantage is due to the AMT drivers Legacy uses- they are much more dynamic and clear (void of driver resonance) because it squeezes the air more effectively than the dome on the Sonus Faber which is mellower and less clear.

This is not to say that the Sonus Faber is not a good speaker- it is. However, I found the Legacy AERIS outperforms it in all key areas, and it does so at about half the price!

steve59's picture

Thanks for adding figure 7 in measurements as it does provide some foundation to your listening notes.

X