| Columns Retired Columns & Blogs |
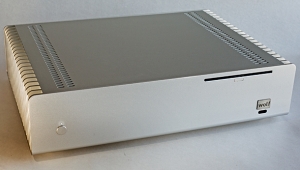
Sonos ZP80 & ZP100 WiFi Music System Measurements
Sidebar 4: Measurements
All measurements of the Sonos Zone Players were made using uncompressed 16-bit AIF files stored on my Mac mini's internal drive and accessed via a hardwired Ethernet connection. (I found no differences doing spot-check comparisons over the wireless link.) I did check the integrity of the data transmitted over the wireless link, selecting a variety of Apple Lossless files in my iTunes library and played these on the ZP80 in my listening room. I recorded the ZP80's digital output on my laptop, using a Metric Halo FireWire interface to turn the S/PDIF data into SD2 files. These were then translated to AIF files, which were compared, bit for bit, with the original AIFs that had been used to generate the ALC versions. There were no differences, showing that Apple Lossless, the Sonosnet encoding and encryption, and the ZP80's data processing are all transparent to the original data.
Looking first at the ZP80's analog output set to Fixed, the maximum level at 1kHz was 2.12V, 0.5dB higher than the CD standard's 2V RMS. The output preserved absolute polarity— ie, it was noninverting—and was sourced from a usefully low impedance of around 93 ohms across most the audioband, this rising to 224 ohms at 20Hz. This rise will be inconsequential with typical preamplifiers having an input impedance of 10k ohms or more, but with the low, "torture test" load of 600 ohms it does result in the response starting to roll off at low-bass frequencies, reaching –3dB at 14Hz (fig.1, bottom pair of traces). Into 100k ohms (fig.1 top traces), the LF response was flat to 30Hz or so. At the other end of the spectrum the output is down 0.5dB at 20kHz, which will not be audible.
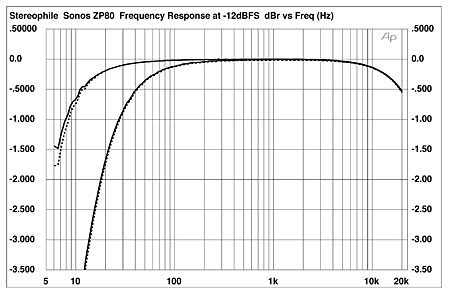
Fig.1 Sonos ZP80, frequency response at –12dBFS into 100k ohms (top below 200Hz) and 600 ohms (bottom below 200Hz). (Right channel dashed, 0.5dB/vertical div.)
I didn't test the Sonos with pre-emphasized data, as this will be irrelevant. However, if you do rip a pre-emphasized CD (they're rare), you need to equalize the audio files with a program like that available from www.picosound.de/E_index.htm. (My thanks to reader and denizen of our website forums Jeff Wong for alerting me to the existence of this program.) I understand that iTunes also compensates for pre-emphasis, if present, during ripping.
Channel separation (not shown) was superb, at better than 110dB below 3kHz, and still 96dB at 20kHz. Spectral analysis of a dithered 1kHz tone at –90dBFS was free from AC supply artifacts, though the noise level was a little higher than the best 16-bit D/As (fig.2). Extending the measurement bandwidth to 200kHz and repeating the spectral analysis, playing a file comprising a –1LSB DC offset revealed a rising level of ultrasonic noise well above the audioband, due to the noiseshaping used in the DAC to achieve 16-bit performance (fig.3).
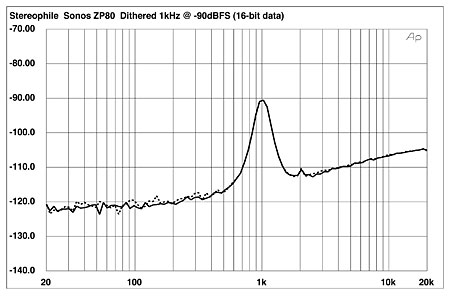
Fig.2 Sonos ZP80, 1/3-octave spectrum with noise and spuriae of dithered 1kHz tone at –90dBFS, 16-bit data (right channel dashed).
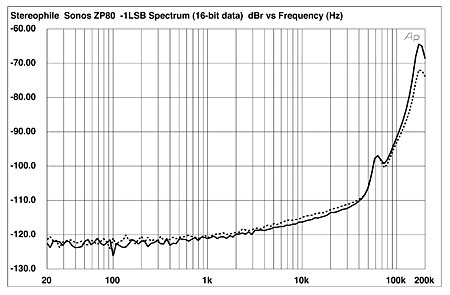
Fig.3 Sonos ZP80, 1/3-octave spectrum with noise and spuriae of –1LSB, 16-bit data (right channel dashed).
Linearity error was low to below –100dBFS (fig.4), with almost all the apparent error actually resulting from the dither used to encode the 500Hz test signal. The ZP80's reproduction of an undithered 1kHz sinewave at exactly –90.31dBFS, which consists of just three voltage levels, showed excellent waveform symmetry (fig.5).
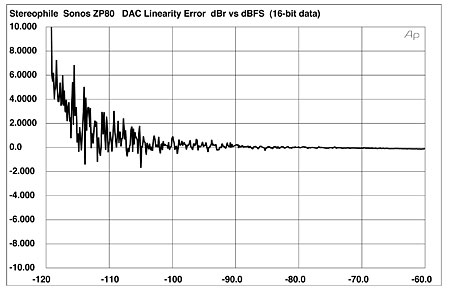
Fig.4 Sonos ZP80, left-channel departure from linearity, 16-bit data (2dB/vertical div.).
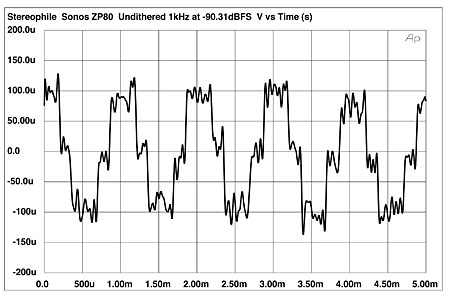
Fig.5 Sonos ZP80, waveform of undithered 1kHz sinewave at –90.31dBFS, 16-bit CD data.
The ZP80's analog output offered very low levels of harmonic distortion, though at maximum level (fig.6) some low-level, higher-order harmonics could be seen in addition to the third harmonic at –84dBFS (0.006%). Reducing the load to 600 ohms increased the level of the third harmonic to –80dB (0.01%), but did not affect the levels of the higher harmonics (not shown). Dropping the signal level to –90dBFS resulted in all the harmonic components lying at or below the ZP80 DAC's noise floor (fig.7). This graph, by the way, was taken under the same measurement conditions as fig.2. The observable differences between these two graphs, such as the fact that the noise floor is flat in fig.7 but slopes up with frequency in fig.2, are due to the different analyzers used: a swept analog 1/3-octave bandpass filter and a logarithmic frequency scale in fig.2, FFT analysis and a linear frequency scale in fig.7.
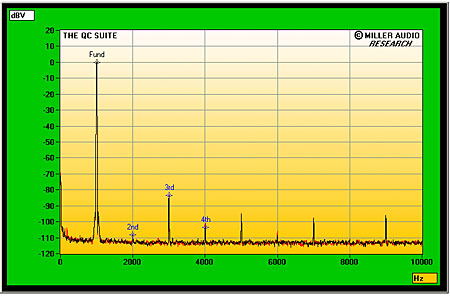
Fig.6 Sonos ZP80, spectrum of 1kHz sinewave at 0dBFS into 5k ohms, DC–10kHz, 16-bit data (linear frequency scale).
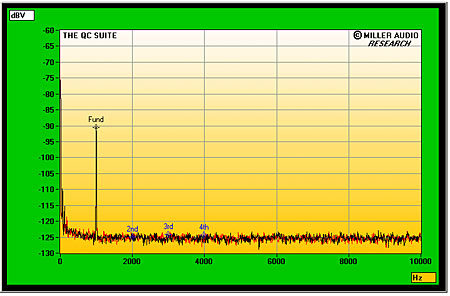
Fig.7 Sonos ZP80, spectrum of 1kHz sinewave at –90dBFS into 5k ohms, DC–10kHz, 16-bit data (linear frequency scale).
Regarding intermodulation distortion, the second-order difference component resulting from feeding the ZP80 with an equal mix of high-level 19kHz and 20kHz tones was very low in level (fig.8). However, some higher-order component can be seen reaching –70dB (0.03%), as well as an aliasing product at 24.1kHz.
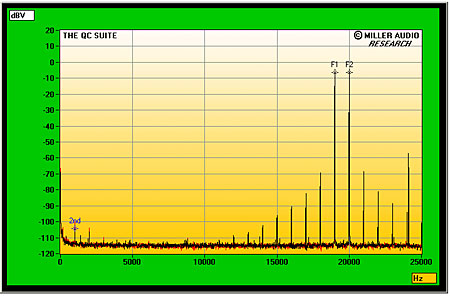
Fig.8 Sonos ZP80, HF intermodulation spectrum, 19+20kHz at 0dBFS peak into 5k ohms, 16-bit data (linear frequency scale).
To test the ZP80's rejection of word-clock jitter, I fed it 16-bit/44.1kHz WAV data representing a high-level 11.025kHz tone over which had been superimposed the LSB toggling off at 229.6875Hz. Both these frequencies are exact integer submultiples of the sample frequency, so there is no quantizing distortion to obscure the DAC performance. The Miller Audio Research Jitter Analyzer (software running on a National Instruments PC card platform) then performs a narrowband FFT analysis of the device under test's analog output signal and identifies sideband pairs due to inadequate jitter rejection.
The results of the ZP80 with this test are shown in fig.9. The calculated jitter level was 388 picoseconds peak–peak, which is low, especially considering how much processing is performed within the ZP80 and Sonosnet. Sidebands associated with the low-frequency toggling are indicated with red numeric markers; other than the pair at 11.025kHz ±229Hz (red "4" markers), all of these are at the residual level of the test signal. The main jitter-related sidebands lie at ±11.2Hz (purple "1"), ±27.8Hz (purple "2), ±38.6Hz (purple "3"), ±763Hz (purple "7"), and ±1476Hz (purple "10"). Note also the slight widening of the central peak in this graph. However, I have no idea what mechanisms produce these sidebands, and it is fair to note that any correlation between this sort of behavior and sound quality has not been established.

Fig.9 Sonos ZP80, high-resolution jitter spectrum of analog output signal (11.025kHz at –6dBFS sampled at 44.1kHz with LSB toggled at 229Hz), 16-bit data. Center frequency of trace, 11.025kHz; frequency range, ±3.5kHz.
The ZP80's analog inputs had a usefully high impedance of approximately 38k ohms in the bass and midrange, rising slightly to 45k ohms at 20kHz. They feed a 16-bit A/D converter running at 44.1kHz, and the sensitivity of this converter needs to be set with either the handheld controller or the Desktop Controller running on the host computer. With the sensitivity set to High, an input level of 598mV at 1kHz gave a digital level of 0dBFS, assessed with RME's DIGICheck running on a PC. Set to Low, the ZP80's analog input needed 2.27V to give 0dBFS. The High and Low labels thus refer to the analog sources' sensitivity and not, as I had originally thought, to their level. These sensitivities have been sensibly chosen.
As with other relatively low-cost A/D converters I have examined, signals close to the maximum level should be avoided. Fig.10 shows spectral FFT analyses, performed in the digital domain by a PrismSound DScope 2, of the ZP80's analog input fed 1kHz tones at –1dBFS (red) and –33dBFS (blue). A regular series of harmonics is evident in the high-level tone, though it is fair to note that these all lie at –100dB or below. Of greater concern is the general dirtiness of the noise floor. However, all these spuriae have disappeared with the low-level tone, implying that the best sound will be obtained by setting the sensitivity one increment lower than might be thought appropriate, to avoid using the top 6dB of dynamic range. These spectra were obtained with the ZP80's line input set to produce uncompressed WAV data. Setting it to lossy-compressed WMA data resulted in the noise floor below 7kHz or so being modulated by the level of the input signal (fig.11).
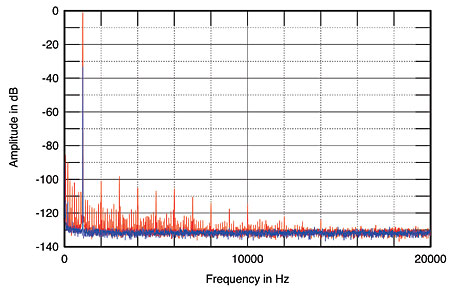
Fig.10 Sonos ZP80, analog input set to WAV encoding, digital-domain spectra of 1kHz sinewave at –1dBFS (red) and –33dBFS (blue), DC–20kHz (linear frequency scale).
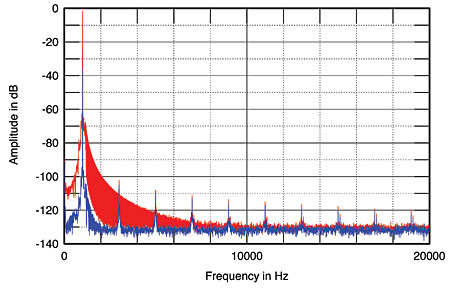
Fig.11 Sonos ZP80, analog input set to WMA encoding, digital-domain spectra of 1kHz sinewave at –1dBFS (red) and –33dBFS (blue), DC–20kHz (linear frequency scale).
The ZP100, too, was tested using AIF files stored on the Mac mini, but it was connected exclusively with the WiFi link. Because the player operates with sample rates only up to 48kHz, the tests are of necessity limited to the audioband. I haven't shown the squarewave results, therefore, because these are dominated by the so-called "ringing" of the anti-aliasing filter. I didn't repeat the digital-domain tests, on the assumption that the results would be very similar to the ZP80's.
The sensitivity with the volume control set to its maximum was such that a 1kHz tone at –10dBFS produced an output of 7.6V into 8 ohms, implying a maximum level of 24V, or the equivalent of 72W into 8 ohms—somewhat higher than the specified 50Wpc. The amplifier preserved absolute signal polarity; ie, a positive-going impulse in the digital domain produced a positive-going voltage pulse at the speaker terminals.
As the ZP100 uses a class-D output stage, it also uses a passive low-pass filter in series with its output to prevent the speaker cables radiating RF noise. This filter rolls off the amplifier's frequency response into 2 ohms (fig.12, bottom dotted trace) and 4 ohms (fig.12, middle solid and dotted traces), but peaks up the response into both 8 ohms and our standard simulated load by 2dB at 20kHz (fig.12, top traces). The ZP100's source impedance was a low 0.16 ohm at bass and midrange frequencies, rising to almost 2 ohms at 20kHz, due to the series filter. The effect of the tone controls set to their maximum and minimum positions is shown in fig.13. The amounts of boost and cut and the frequency ranges of the controls have been sensibly chosen, though it is fair to note that you can't use the top 10dB or so of the amplifier's volume-control range if you also want to apply the maximum tone-control boost.
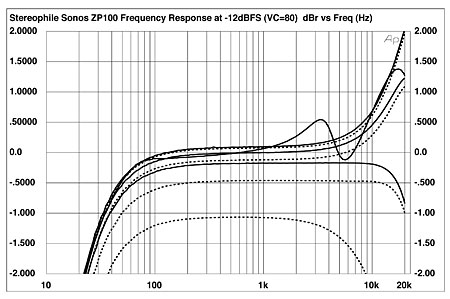
Fig.12 Sonos ZP100, frequency response at 2.83V into (from top to bottom at 2kHz): simulated loudspeaker load, 8, 4, 2 ohms (0.5dB/vertical div., right channel dashed).
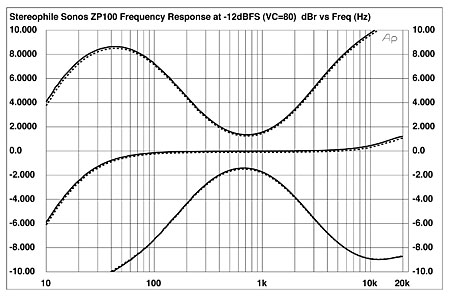
Fig.13 Sonos ZP100, effect of tone controls set to their maximum and minimum positions on frequency response into 8 ohms (2dB/vertical div., right channel dashed).
Even with the low-pass filter present at the ZP100's output there is still a fair amount of VHF noise present, around 185mV, although this is only when the amplifier is passing signal. If the file being played reaches the end and another is not ready in the queue, the amplifier appears to turn off its output stage. I tested the ZP100's signal/noise ratio, therefore, by playing the 16-bit, –1LSB file mentioned in my test notes on the ZP80. The wideband, unweighted ratio (ref. 1W into 8 ohms with the volume control at its maximum) was just 29.5dB due to the RF noise. Reducing the measurement bandwidth to the audioband improved the unweighted ratio to a respectable 75.4dB, while switching in an A-weighting filter gave further improvement, to 80.7dB. Channel separation (not shown) was excellent, at better than 90dB in the midrange, this decreasing slightly to 66–70dB at 20kHz.
To plot the THD+noise percentage present in the ZP100's output against power, I fed it a 1kHz tone from a 16-bit AIF file and increased the amplifier's volume-control level, noting the THD+N level with each step. The results are shown in fig.14: the downward slope of the traces indicates that the reading is dominated by the RF noise present in the ZP100's output almost up to the point where the waveform starts to clip. (As well as the expected squaring-off of the waveform tops and bottoms, these began to be overlaid with a small amount of ringing.) At 1% THD+N with both channels driven, the ZP100 exceeded its specifications by putting out 59W into 8 ohms (17.7dBW) and 106W into 4 ohms (17.25dBW). With one channel driven into 2 ohms, however, the amplifier appeared to go into protection at 81W (13.06dBW), even though the THD+N was just 0.066% (fig.14, bottom trace).
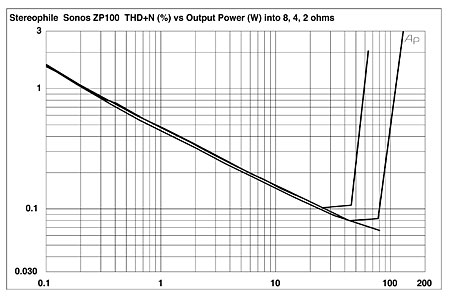
Fig.14 Sonos ZP100, distortion (%)vs 1kHz continuous output power into (from bottom to top at 80W): 8, 4, 2 ohms.
I examined how the small-signal THD+N percentage varied with frequency in two ways: first, with the amplifier's output connected directly to the analyzer input; and second, with a sixth-order low-pass filter inserted to eliminate the out-of-band noise. The results are shown in fig.15. The top traces show the behavior into 8, 4, and 2 ohms without the filter—all you're really looking at is the effect of the residual switching noise. With the filter (bottom traces), the ZP100 produces respectably low THD figures, though the amount does rise at the extremes of the audioband.
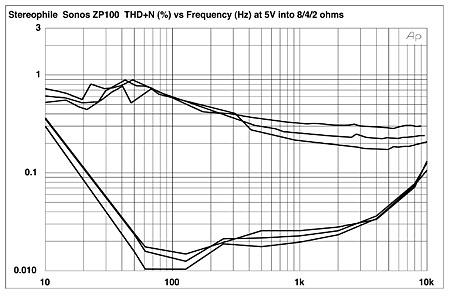
Fig.15 Sonos ZP100, left-channel THD+N (%)vs frequency at 5V into (from bottom to top): 8, 4, 2 ohms with and without 30kHz low-pass filter.
Figs.16 and 17 are oscilloscope-screen captures taken at the same power level—again, without and with the 30kHz low-pass filter, respectively. Fig.16 merely shows the ultrasonic noise present in the amplifier's output; fig.17 reveals that the only significant distortion harmonic present is the third, though this is still very low in level. At low frequencies and higher powers (fig.18), the third harmonic is joined by the second. The ZP100's handling of the high-frequency intermodulation-distortion "torture test" was good rather than great (fig.19), some higher-order spuriae almost reaching –60dB (0.1%).
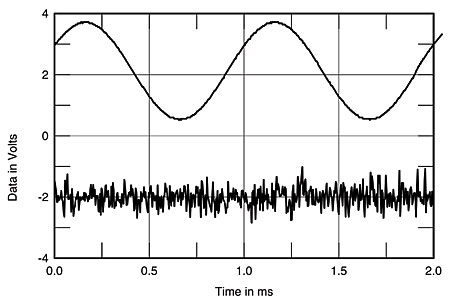
Fig.16 Sonos ZP100, 1kHz waveform at 6.2W into 8 ohms (top), 0.196% THD+N; distortion and noise waveform with fundamental notched out (bottom, not to scale).
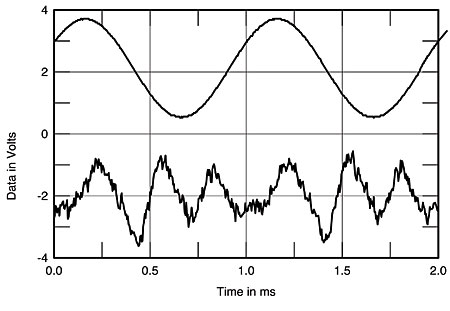
Fig.17 Sonos ZP100, 1kHz waveform at 3.22W into 4 ohms (top), 0.0143% THD+N; distortion and noise waveform with fundamental notched out (bottom, not to scale), with 30kHz sixth-order low-pass filter.
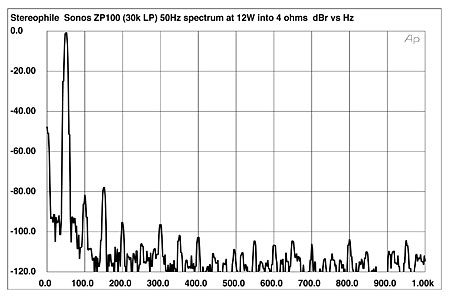
Fig.18 Sonos ZP100, spectrum of 50Hz sinewave, DC–1kHz, at 12W into 4 ohms (linear frequency scale) with 30kHz sixth-order low-pass filter.
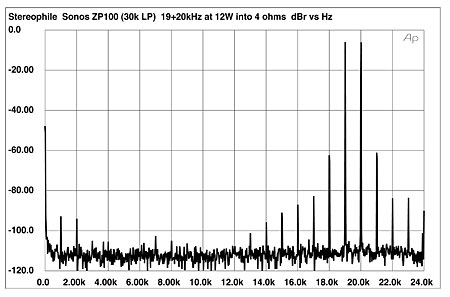
Fig.19 Sonos ZP100, HF intermodulation spectrum, DC–24kHz, 19+20kHz at 12W peak into 4 ohms (linear frequency scale) with 30kHz sixth-order low-pass filter.
Overall, and taking into consideration their very affordable prices, both Sonos Zone Players offer very respectable measured performance.—John Atkinson
NEXT: Sonos Bundle 250, April 2010 »
|
|
| ||||||||||
- Log in or register to post comments


| Loudspeakers Amplification Digital Sources | Analog Sources Accessories Featured | Music Columns Retired Columns | Show Reports | Features Latest News Community | Resources Subscriptions |
 © 2024 Stereophile
AVTech Media Americas Inc., USA
All rights reserved

