| Columns Retired Columns & Blogs |
Revel Performa3 M106 loudspeaker Measurements
Sidebar 3: Measurements
I used DRA Labs' MLSSA system and a calibrated DPA 4006 microphone to measure the Revel Performa3 M106's frequency response in the farfield, and an Earthworks QTC-40 for the nearfield responses. Though the M106 is supplied with a grille, and an optional foam plug for its port, I performed the measurements without either. Revel specifies the M106 as having a voltage sensitivity of 87dB/2.83V/m; my estimate was 86.4dB(B)/2.83V/m, which is within experimental error of the specified figure. My impedance measurement confirmed the 8 ohm spec, the speaker's impedance magnitude (fig.1, solid trace) ranging between 5 and 10 ohms for much of the audioband. The electrical phase angle reached –48° at 29Hz, but the magnitude was 10 ohms at that frequency, ameliorating the phase angle's negative effect on ease of drive. However, as there are combinations of 5.76 ohms and –34° at 138 and 2400Hz, both frequencies at which music can have a lot of energy, an amplifier or receiver rated at 4 ohms would probably work best with this speaker.
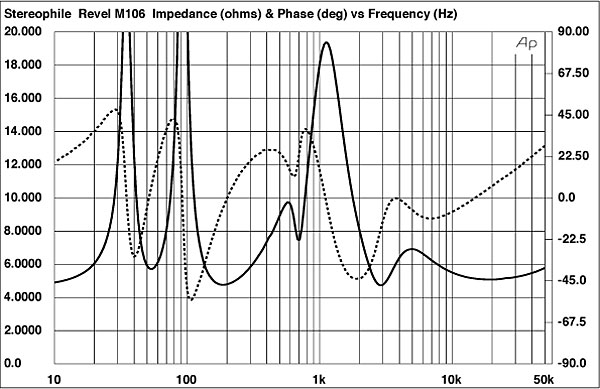
Fig.1 Revel Performa3 M106, electrical impedance (solid) and phase (dashed) with HF control set to: maximum (bottom traces), minimum (top) (2 ohms/vertical div.).
The traces in fig.1 are free from the small wrinkles that would suggest the presence of panel resonances. However, when I investigated the vibrational behavior of the enclosure with a PVDF plastic-tape accelerometer, I did find a reasonably strong mode on the sidewalls (fig.2); and the same mode, plus another at 348Hz, on the top panel. However, given the small radiating areas affected and the high frequency of the sidewall mode, I doubt that these resonances will have audible consequences.

Fig.2 Revel Performa3 M106, cumulative spectral-decay plot calculated from output of accelerometer fastened to center of side panel (MLS driving voltage to speaker, 7.55V; measurement bandwidth, 2kHz).
The saddle centered between 50 and 60Hz in the impedance-magnitude trace suggests that the large flared port on the rear panel is tuned in this region. The corresponding minimum-motion notch in the woofer's nearfield output (fig.3, blue trace) occurs at 53Hz, with the port's output peaking between 35 and 90Hz. This is somewhat higher in frequency than I would have expected from BJR's auditioning comments. Although a peak at 400Hz is present in the port's upper-frequency rolloff, this is well suppressed. (Too many small speakers feature severe pipe resonances in the midrange output of their ports.) The complex sum of the nearfield woofer and port outputs, taking into account both acoustic phase and the different distances of the radiators from a nominal farfield microphone position, is shown in fig.3 as the black trace below 300Hz. The broad peak in the upper bass in this graph is almost entirely an artifact of the nearfield measurement technique; the M106 is actually maximally flat, with then a –6dB point at the port tuning frequency—exactly as specified.
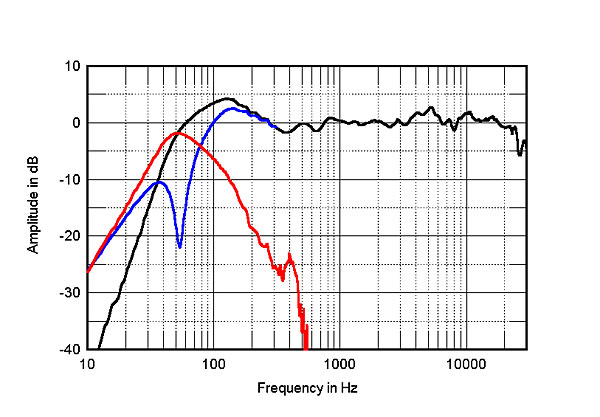
Fig.3 Revel Performa3 M106, anechoic response on tweeter axis at 50", averaged across 30° horizontal window and corrected for microphone response, with nearfield responses of woofer (blue), port (red), and their complex sum, respectively plotted below 300Hz, 600Hz, and 300Hz.
Higher in frequency in fig.3, the Performa M106 is superbly flat almost up to the 30kHz limit of this graph, with just a slight excess of energy apparent in the bottom octave of the tweeter's passband. The plot of the M106's lateral dispersion, referenced to the tweeter-axis response (fig.4), shows a slight accentuation of this region to the speaker's sides; this is probably insufficient to add brightness to the M106's tonal balance, but does correlate with BJR's feeling that the Revel had "transients [that] . . . were pristine, with extended and airy highs." The contour lines in this graph are evenly spaced, which tends to tie in with stable, accurate stereo imaging. In the vertical plane (fig.5), a deep suckout develops in the crossover region more than 5° above and 15° below the tweeter axis, suggesting that high stands will be more appropriate than low ones.
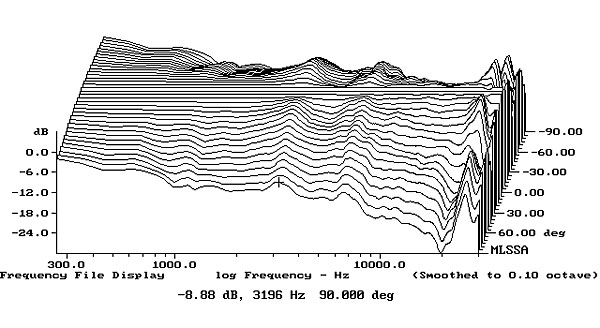
Fig.4 Revel Performa3 M106, lateral-response family at 50", normalized to response on tweeter axis, from back to front: differences in response 90–5° off axis, reference response, differences in response 5–90° off axis.
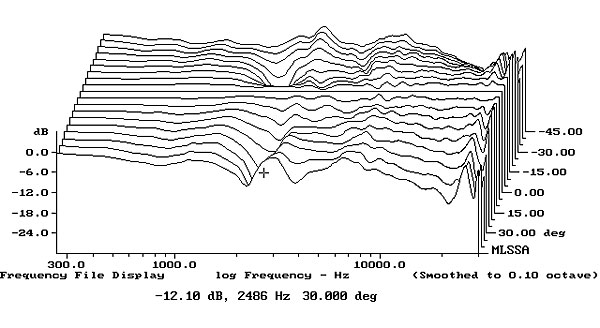
Fig.5 Revel Performa3 M106, vertical-response family at 50", normalized to response on tweeter axis, from back to front: differences in response 45–5° above axis, reference response, differences in response 5–45° below axis.
Turning to the time domain (fig.6), the M106's step response on its tweeter axis indicates that both drive-units are connected in positive acoustic polarity. The tweeter's output arrives first at the microphone, but the smooth blending of the decay of its step with the rise of the woofer's step correlates with the excellent frequency-domain integration of their outputs seen in fig.3. The cumulative spectral-decay plot on the tweeter axis (fig.7) is simply superb, with a clean decay throughout the midrange and treble.
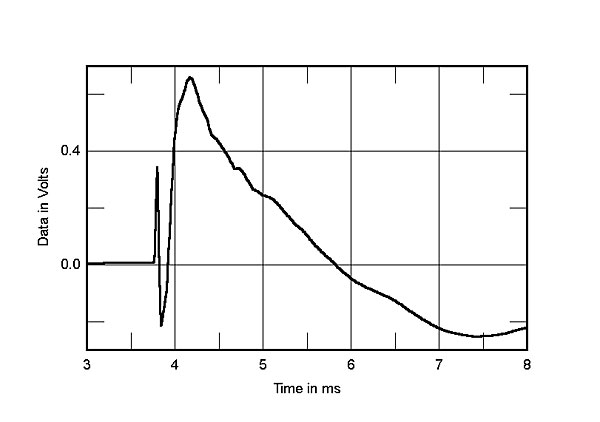
Fig.6 Revel Performa3 M106, step response on tweeter axis at 50" (5ms time window, 30kHz bandwidth).
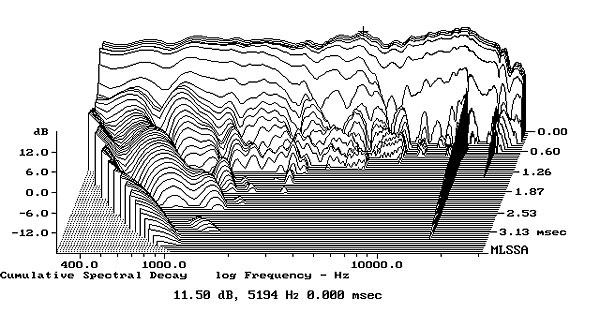
Fig.7 Revel Performa3 M106, cumulative spectral-decay plot on tweeter axis at 50" (0.15ms risetime).
Like Revel's Performa3 F208 tower model, which Erick Lichte reviewed for Stereophile in July 2014, the Performa3 M106 demonstrates excellent measured performance that in turn reveals inspired audio engineering. Though I am sure he will not appreciate it, given his disdain for the spotlight, I will give a shout-out to Harman's Mark Glazer, who, working with Kevin Voecks, has been responsible for much of the fundamental engineering of Revel speakers since the late 1990s.—John Atkinson
|
| ||||||||||
- Log in or register to post comments


| Loudspeakers Amplification Digital Sources | Analog Sources Accessories Featured | Music Columns Retired Columns | Show Reports | Features Latest News Community | Resources Subscriptions |
 © 2024 Stereophile
AVTech Media Americas Inc., USA
All rights reserved

