| Columns Retired Columns & Blogs |
Wilson Sasha DAW frequency response is somewhat similar to the Rethm Maarga ......... See, manufacturer's comment ..... Sasha DAW also has a 'dip' in the presence region in addition to midrange 'dip' :-) ........
After driving to Sasha Matson's place in upstate New York last September to measure the Wilson Sasha DAW speakers that he reviewed in the January issue, I stopped off at Art Dudley's place in Albany on my way home the next day to measure the Rethm Maargas. As always, I used DRA Labs' MLSSA system and a calibrated DPA 4006 microphone to measure the Maarga's frequency response in the farfield, and an Earthworks QTC-40 mike for the nearfield and spatially averaged room responses. I used my usual Krell KSA-50 amplifier for the quasi-anechoic measurements but measured the room response with the Shindo Haut-Brion, with which Art had done most of his auditioning of the Maargas.
When testing a loudspeaker, I raise it off the floor so that the tweeter is midway between the ceiling and floor. This maximizes the anechoic time window, hence the midrange resolution, of the FFT-based response measurements. We lifted one of the Maargas onto a small dolly and aimed it across the longer diagonal in AD's room to push the reflections from the sidewalls back in time. However, the reflection of the speaker's sound from the floor will reduce the accuracy of my quasi-anechoic measurements in the midrange.
Rethm specifies the Maarga's sensitivity as an extraordinarily high 98dB/W/m. When I returned home and started looking at the measurements, my estimate was significantly lower. Before I perform the measurements of a loudspeaker under review, I measure the on-axis response and sensitivity of a BBC LS3/5a loudspeaker that I have been using as a reference since I started publishing loudspeaker measurements in 1989. The LS3/5a measurement was as I expected. I therefore returned to Art's place a couple of weeks later to reexamine the sensitivity of both the Maarga and of AD's reference DeVore Orangutan O/93s, in case there had been a systematic error with the MLSSA system and its ancillary equipment. On this visit, I used Dayton Audio's OmniMic system, with its calibrated microphone, and the amplifier was Art's daughter's Peachtree Nova300 rather than the Krell. The result was the same, however: a much lower sensitivity than specified.
A few days later, we heard from Rethm's Jacob George that the review samples of the Maarga had been incorrectly assembled and that he needed to modify them. This mandated not only re-auditioning but also re-measuring. Accordingly, I traveled to Albany a third time and redid both the quasi-anechoic measurements and the spatially averaged in-room response. I also examined the impedance of the revised loudspeaker using Dayton Audio's DATS V2 system.
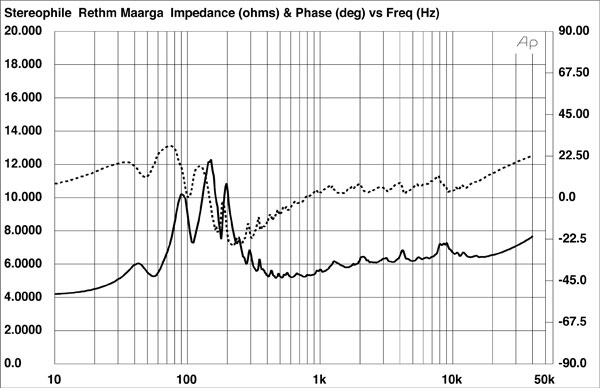
I don't know how the speakers had been modified, but while the impedance was the same as before, my estimate of the Maarga's sensitivity, again measured with MLSSA and the Krell amplifier, was the specified 98dB(B)/2.83V/m. This is one of the highest voltage sensitivities I have measured, only bettered by the Klipschorn AK6 (101.1dB(B)/2.83V/m) and the Auditorium 23 Hommage Cinema (102dB(B)/2.83V/m). The specified impedance is 8 ohms. My measurements of the Maarga's impedance magnitude (solid trace) and electrical phase angle (dotted trace) are shown in fig.1. The impedance is close to 6 ohms from 300Hz to 20kHz, with a minimum value of 5.2 ohms in the midrange. There is an unusual triple-humped shape to the trace in the upper bass, though the electrical phase angle (dashed trace) is generally low.
When I investigated the enclosure's vibrational behavior with a plastic-tape accelerometer, I found several high-Q modes in the midrange on all the surfaces (fig.2). Given the Maarga's very high sensitivity, this behavior is unlikely to be audible.
The red trace in fig.3 shows the nearfield response of the powered woofer with the crossover frequency set to 240Hz; the blue trace combines the revised Maarga's farfield response with the speaker driven by the Krell, averaged across a 30° horizontal window centered on the passive drive-unit's axis and spliced to the unit's nearfield response at 312Hz. Other than the increased sensitivity, the passive driver's output is very similar to what I measured on my first visit to Albany: The treble is broken by several peaks and dips and the speaker's output gently slopes down below 1100Hz before crossing over to the powered woofer around 300Hz.
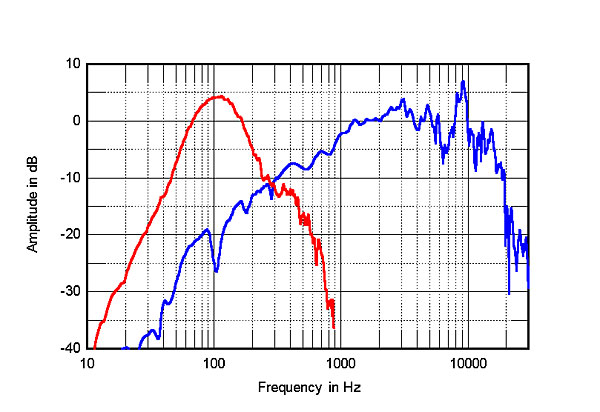
I could hear the lack of midrange energy with the noiselike MLSSA signal. I suspect that as there is only a vestigial baffle around the passive drive-unit, this lack was due to the design's baffle step being higher in frequency than usual (footnote 1). Loudspeaker drive-units are omnidirectional at low frequencies, due to the fact that the wavelengths of the sound are much larger than the size of the baffle in which they are mounted. As the frequency rises to where the wavelength is of the same order as the baffle's dimensions, the sound starts to become directional. As more energy is now being projected in the forward direction, the on-axis response rises, exactly as can be seen with the blue trace in fig.3. That the Maarga's baffle-step frequency is high is directly related to its use of a vestigial baffle and, as there is no crossover, there can be no compensation for the baffle-step behavior.
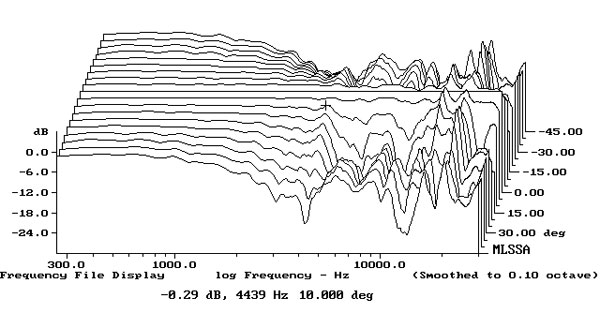
The Rethm Maarga's horizontal dispersion, normalized to the driver-axis response, is shown in fig.4. (Due to the geometric limitations of AD's room, I could only plot the differences in response up to 45° each side of the tweeter axis instead of my usual 90°.) This graph indicates that some of the on-axis peaks in the treble are compensated for by a lack of energy to the speaker's sides, where there is also more top-octave energy. A similar picture can be seen in the vertical plane (fig.5).
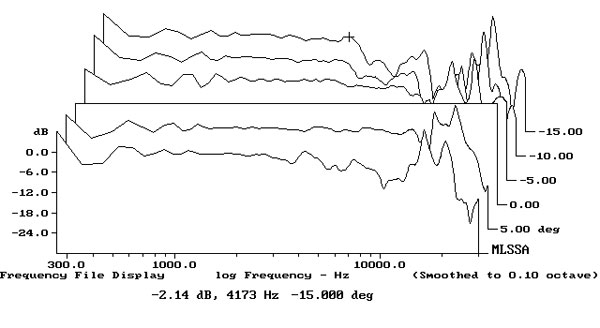
The red trace in fig.6 shows the Maargas' spatially averaged response in Art's room. This is generated by averaging 20 1/6-octave–smoothed spectra, taken for the left and right speakers individually in a rectangular grid 36" wide × 18" high and centered on the listening position. For reference, the blue trace shows the spatially averaged response of Art's DeVore Fidelity Orangutan O/93s. (Because the DeVore is significantly less sensitive than the Rethm, I have increased the level of its trace by 10dB.) Both traces are restricted to frequencies above 35Hz, as there was a lot of afternoon rush-hour subsonic traffic noise in Art's room when I took the in-room measurements.
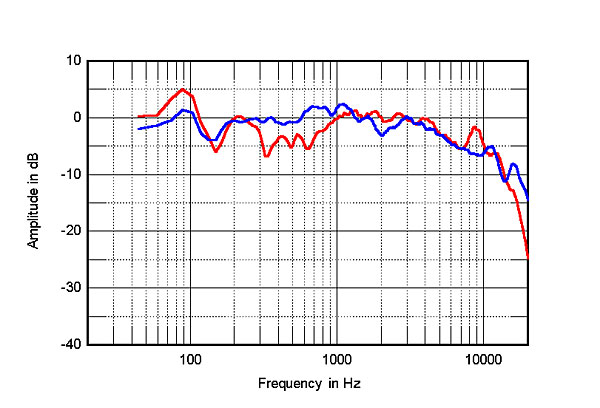
These responses were taken on my third visit, and, as the Shindo amplifier I had used for the earlier measurement was no longer available, I used the Air Tight amplifier that Art had used for some of his auditioning of both versions of the Rethm speaker. Despite the different amplifiers, the spatially averaged responses of the two versions of the Maarga were very similar, other than the revised speaker having slightly more midrange energy than the original. Nevertheless, there is still 3–6dB less energy present between 200Hz and 800Hz compared with the Orangutan O/93s. The Rethms are a little smoother in the low treble, and other than the small peak at 9kHz, its in-room output in the top two octaves is similar to the DeVore's. (The sloped-down response above 3kHz in this graph is due to the increased absorption of the room's furnishings. What you don't want to see in this kind of graph is a flat response in this region, as this means the on-axis response will be excessive.)
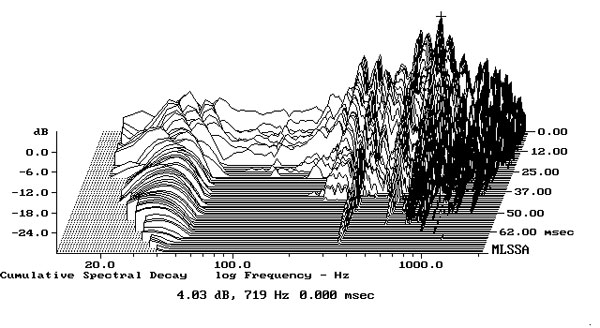
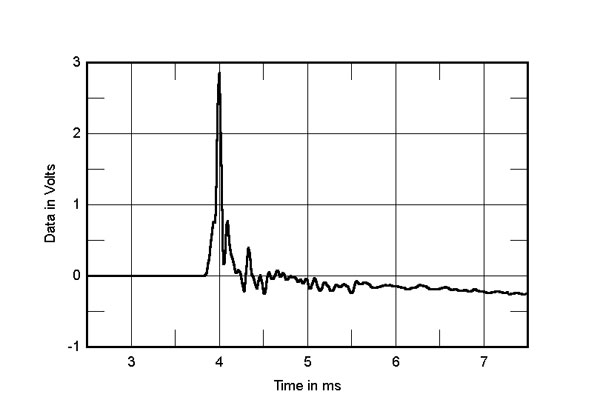
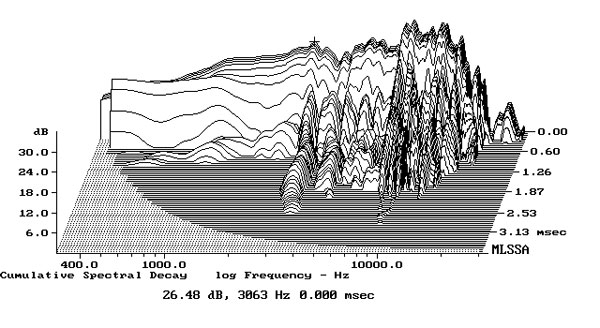
The Maarga's quasi-anechoic step response (fig.7) is dominated by the output of the passive drive-unit. The speaker doesn't invert polarity, but the fundamentally time-coherent step is overlaid by reflections and resonances that can be seen in the cumulative spectral-decay plot (fig.8).
The Maarga's apparent design brief was to create a speaker with high sensitivity and a single main, wide-bandwidth driver (and with any sonic virtues those things bring)—but with bass. Those objectives have been achieved. As these measurements show, however, those are hard objectives to achieve without some compromises in other areas of performance.—John Atkinson
|
| ||||||||||

Wilson Sasha DAW frequency response is somewhat similar to the Rethm Maarga ......... See, manufacturer's comment ..... Sasha DAW also has a 'dip' in the presence region in addition to midrange 'dip' :-) ........
DeVore Gibbon X also has similar FR as the Rethm Maarga, with additional 'dip' in the presence region :-) ......
and ..... they all need amplifiers to drive them too! :-) ........
and ....... they all need speaker wires to connect them to the amplifiers! :-) ........
Rethm Maaga is a little bit different though ....... It has a 'whizzer cone' :-) ........
So is the full ranger 6" as stated in the "description" or 8" as stated in the "specification"?
"I found several high-Q modes in the midrange on all the surfaces (fig.2). Given the Maarga's very high sensitivity, this behavior is unlikely to be audible."- JA
I am curious as to JA's reasoning behind this statement. Sensitivity is an electrical parameter, or how much electrical input is required to get a specific acoustic output.
I do not understand why the sensitivity of the loudspeaker. Would have anything to do with the excitation of resonnant modes in the enclosure. The sidewalls of the speaker should be effectively "blind" to the electrical input, only responding to the mechanical and acoustical output of the speaker cone. As most investigations have shown that it is primarily the acoustic pressure transmitted through the air inside the enclosure, which excite midrange modes, even the fact that the cone may be slightly lower in mass should have little impact.
Would you help me understand your reasoning behind your statement?

I found several high-Q modes in the midrange on all the surfaces (fig.2). Given the Maarga's very high sensitivity, this behavior is unlikely to be audible."I am curious as to JA's reasoning behind this statement.
I measure a loudspeaker enclosure's vibrational behavior with a standard input voltage. This means that the higher the speaker's sensitivity, the greater the output of the drive-units compared with that of the enclosure.
John Atkinson
Technical Editor, Stereophile


| Loudspeakers Amplification Digital Sources | Analog Sources Accessories Featured | Music Columns Retired Columns | Show Reports | Features Latest News Community | Resources Subscriptions |
 © 2024 Stereophile


