| Columns Retired Columns & Blogs |
Reference MM de Capo i loudspeaker Measurements
Sidebar 3: Measurements
The MM de Capo i's voltage sensitivity was above average, at an estimated 91dB(B)/2.83V/m, which is slightly but inconsequentially less than specified. Its impedance (fig.1) was reasonably benign, dropping below 6 ohms only in the lower midrange and the high treble. (The speaker is thus both sensitive and efficient.) The minimum value was 5.1 ohms at 10kHz, and the electrical phase angle was generally mild. Note that the shape of the impedance curve means that using this speaker with a tube amplifier having a high source imepdance will pull down its midrange level compared with solid-state drive. The significance of this will become apparent.
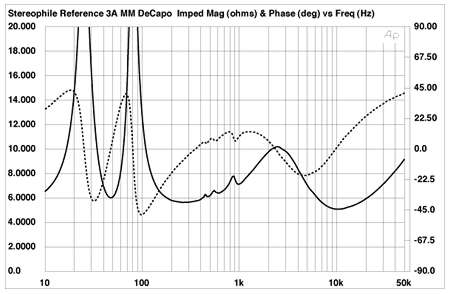
Fig.1 Reference 3A MM de Capo i, electrical impedance (solid) and phase (dashed). (2 ohms/vertical div.)
There are three significant glitches in the impedance traces, between 400Hz and 900Hz, which indicate the presence of cabinet resonances. Examining the panel's vibrational behavior with a plastic-tape accelerometer reveals some major resonances to be present, particularly on the rear panel (fig.2). However, it is fair to note that Art Dudley didn't comment on any coloration that could be traced to this behavior.
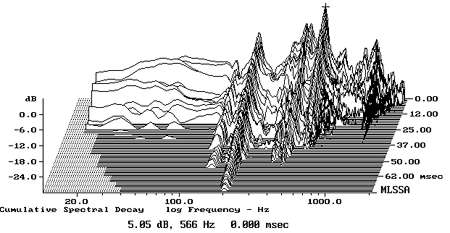
Fig.2 Reference 3A MM de Capo i, cumulative spectral-decay plot calculated from the output of an accelerometer fastened to the cabinet's rear panel. (MLS driving voltage to speaker, 7.55V; measurement bandwidth, 2kHz.)
The saddle at 46Hz in the impedance-magnitude trace indicates the tuning frequency of the 2.5"-diameter port on the rear panel, which was confirmed by nearfield measurement of the woofer's output. Its response curve (fig.3) is marked by a sharp null at the same frequency, due to the port resonance applying sufficient back pressure at this frequency to hold the woofer cone motionless. As can also be seen from fig.3, all the speaker's acoustic output then comes from the port. The port's response is basically smooth within its passband, but is marred by three midrange peaks. Not coincidentally, these lie at the frequencies of the glitches in the impedance traces.
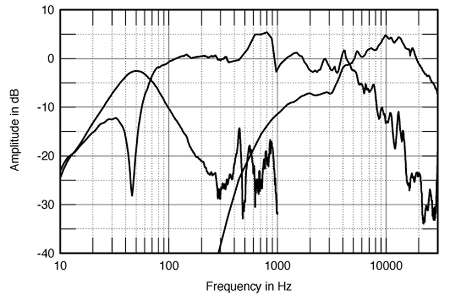
Fig.3 Reference 3A MM de Capo i, acoustic crossover on tweeter axis at 50", corrected for microphone response, with the nearfield responses of the woofer and port plotted below 300Hz and 1kHz, respectively.
The woofer is driven without any low-pass crossover filter intervening, so the upper-frequency rolloff seen in fig.3 is its natural behavior. With the tweeter filtered by a single series capacitor, the two drive-units cross over between 4kHz and 5kHz, the tweeter having a little too much on-axis energy in its top two octaves. As AD found, this will be ameliorated by aiming the speakers straight ahead rather than toeing them in to the listening seat.
AD remarked on the speaker's midrange "bump." This can be clearly seen in fig.3 as an excess of energy in the octave between 500Hz and 1kHz. I would have expected this to add a distinctly nasal coloration, and AD did comment that the speaker made "violins sound a little thicker than they are." However, it is also possible that this response shaping adds an articulate character to the speaker's presentation.
Fig.4 shows the Reference 3a's responses averaged across a ±15 degrees horizontal window on the tweeter axis. The midrange bump can again be seen, as can the excess energy at the top of the tweeter's passband, but the curve is otherwise reasonably even. The MM de Capo's bass looks flat in this graph, but as the nearfield measurement technique should boost the upper bass by 3dB, the speaker's low-frequency tuning is actually a little on the overdamped side. The measured -6dB point was a respectable 42Hz, or about the lowest note of the four-string bass guitar.

Fig.4 Reference 3A MM de Capo i, anechoic response on tweeter axis at 50", averaged across 30 degrees horizontal window and corrected for microphone response, with the complex sum of the nearfield woofer and port responses plotted below 300Hz.
Fig.5 shows how the speaker's balance changes to the sides of the tweeter axis, with those on the tweeter side of the baffle shown to the front of the graph. On this side, the radiation pattern is marred by a major suckout between 3kHz and 6kHz, which I assume is why Reference 3A recommends setting up the speakers with their tweeters on the outside edges. Conventional wisdom holds that using a drive-unit as large as the de Capo's woofer will result in severe beaming at the top of its passband. To my surprise, while the midrange peak and subsequent suckout persist off-axis, the de Capo's dispersion is quite broad between 1kHz and 3kHz, esecially on the side opposite the tweeter. This graph also shows that the tweeter's output rolls off quite quickly to the sides above 10kHz, which is why the MM de Capo's top-octave balance can be adjusted by experimenting with toe-in or the lack thereof.
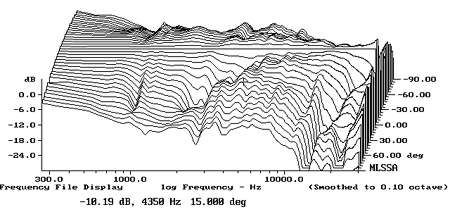
Fig.5 Reference 3A MM de Capo i, lateral response family at 50", normalized to response on tweeter axis, from back to front: differences in response 90 degrees-5 degrees off-axis on side opposite tweeter, reference response, differences in response 5 degrees-90 degrees off-axis on tweeter side of baffle.
In the vertical plane, the use of a minimal crossover results in rather a messy-looking radiation pattern (fig.6), though it does look as if the low-treble balance smooths out a little if you sit just below the tweeter axis. This is confirmed by the MM de Capo i's step response (fig.7), which suggests that the tweeter is not stepped back quite enough for absolute time coherence on its axis. Sitting a little lower than the tweeter will push back the sharp up/down spike in this graph to coincide exactly with the woofer's step response. I am not convinced that such time coherence is worth achieving if it is at the expense of other, more directly audible factors, such as good dispersion and flat perceived response. But it is fair to note that AD was impressed by much of what this speaker did.
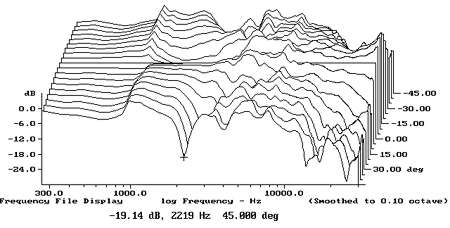
Fig.6 Reference 3A MM de Capo i, vertical response family at 50", normalized to response on tweeter axis, from back to front: differences in response 45 degrees-5 degrees above axis, reference response, differences in response 5 degrees-45 degrees below axis.
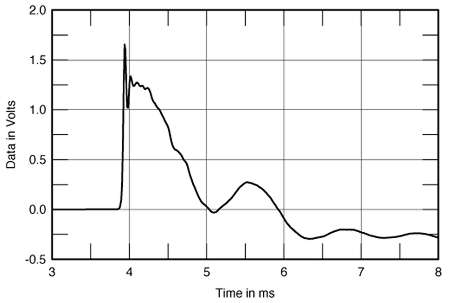
Fig.7 Reference 3A MM de Capo i, step response on tweeter axis at 50" (5ms time window, 30kHz bandwidth).
Note the ringing in the step response, which appears from its period to be associated with the midrange bump in the frequency response. This is confirmed by the speaker's farfield cumulative spectral-decay, or waterfall, plot (fig.8). Even without a low-pass crossover filter on the woofer feed, the decay in the treble is superbly clean. But oh, look at the enormous ridges of resonant energy between 600Hz and 1kHz. I am surprised that AD wasn't bothered more by this behavior.—John Atkinson
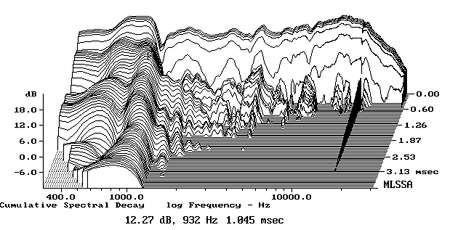
Fig.8 Reference 3A MM de Capo i, cumulative spectral-decay plot at 50" (0.15ms risetime).
|
| ||||||||||
- Log in or register to post comments


| Loudspeakers Amplification Digital Sources | Analog Sources Accessories Featured | Music Columns Retired Columns | Show Reports | Features Latest News Community | Resources Subscriptions |
 © 2024 Stereophile
AVTech Media Americas Inc., USA
All rights reserved

