| Columns Retired Columns & Blogs |
RadioShack Optimus Pro LX5 loudspeaker Measurements
Sidebar 3: Measurements
Footnote 1: For my in-room spectral analyses, I average six measurements at each of 10 separate microphone positions for left and right speakers individually, giving a total of 120 original spectra. These are then averaged to give a curve which in my room has proved to give a good correlation with a loudspeaker's perceived balance. I use an Audio Control Industrial SA-3050A spectrum analyzer with its own microphone, which acts as a check on the MLSSA measurements made with the B&K mike. I also used the Goldline DSP-30 automated spectrum analyzer (currently under review).—John Atkinson
Other than impedance, for which I used an Audio Precision System One, all the measurements were performed with a MLSSA system (v.8.5) from DRA Labs, in combination with an Outline computer-controlled loudspeaker turntable and a B&K 4006 microphone calibrated to be flat on-axis at the typical measuring distance I use. To minimize reflections from the test setup, the measuring microphone is flush-mounted inside the end of a long tube. Reflections of the speaker's sound from the mike stand and its hardware will thus be sufficiently delayed not to affect the measurement.
As might be expected from such a small speaker, the Optimus LX5 doesn't go very loud, 2.83V raising an estimated 81.5dB (B-weighted) on the tweeter axis at 1m. The sensitivity of the two samples differed, however, that of the second sample being a little higher at 83dB at 1m. Still, the speaker is very easy to drive, as can be seen from its plot of impedance magnitude and phase against frequency (fig.1), which only drops below 8 ohms in the region of the 68Hz port-tuning frequency, and in the lower midrange. That the bass impedance peaks are both narrow and high—that due to the box resonance at 125Hz reaching 43 ohms—implies that the bass will be underdamped and somewhat boomy.
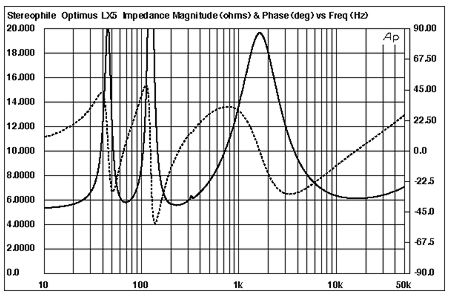
Fig.1 Optimus Pro LX5, electrical impedance (solid) and phase (dashed) (2 ohms/vertical div.).
Which, indeed, is what I heard. Fig.2 shows the effect on the impedance curves of stuffing the ports with drinking straws. The port-tuning frequency remains the same, but the lower impedance peak is knocked down from 20.4 ohms to 11.8 ohms, while its frequency changes from 44Hz to 40Hz. The impedance minimum in the lower midrange also drops from 5.6 ohms to 5 ohms. Plugging up the ports completely gives the traces shown in fig.3, the single peak in the bass typical of a sealed enclosure.
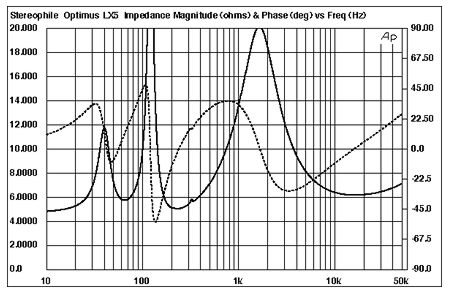
Fig.2 Optimus Pro LX5, electrical impedance (solid) and phase (dashed) with ports filled with nine drinking straws (2 ohms/vertical div.).
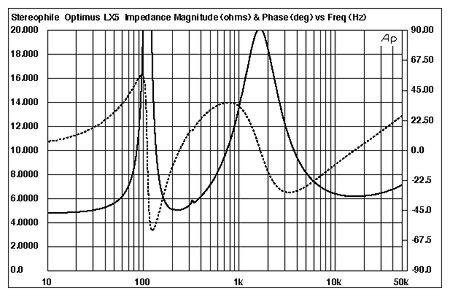
Fig.3 Optimus Pro LX5, electrical impedance (solid) and phase (dashed) with ports sealed (2 ohms/vertical div.).
Note that all three impedance graphs feature a wrinkle at 325Hz. This kind of behavior is usually an indication that the cabinet has a strong resonant mode at that frequency. Unfortunately, I mislaid my accelerometer while I was reviewing the Optimus speaker, and was only able to examine its cabinet's resonant behavior in the time-honored manner: listening to the thing! Playing the half-step frequency sweep from Stereophile's Test CD 3, as well as a swept sinewave, and using a stethoscope, all the enclosure surfaces could be heard to vibrate very strongly at 325Hz—even the tweeter grille—with lively resonant modes also audible at 200Hz, 230Hz, and 290Hz. Though predicting the exact subjective effect of such powerful resonant behavior in the midrange would tax a Nostradamus or even a Dionne Warwicke, their presence probably ties in with the "muffled" character and the lack of clarity in the lower midrange that I noticed in my auditioning.
Fig.4 shows the individual responses of the tweeter, woofer, and port. The first two were taken on the tweeter axis, midway between the two "beer cans," while the latter was taken in the nearfield (no straws). The woofer response below 300Hz was also taken in the nearfield, and can be seen to peak up by 5dB or so at 125Hz before rapidly rolling off to reach its minimum-motion point at the port tuning frequency. (At this frequency, the back pressure from the resonance prevents the woofer cone from moving at all, all the acoustic output coming from the port.) The output of the two ports is the bandpass response peaking between 40Hz and 120Hz, and is quite a bit down from the woofer level.
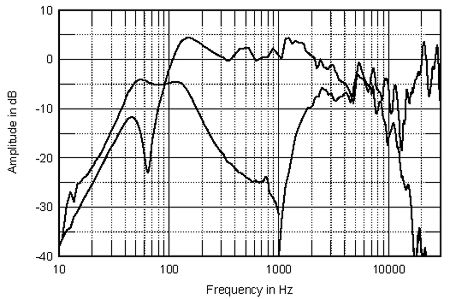
Fig.4 Optimus Pro LX5, sample 1, acoustic crossover on tweeter axis at 50", corrected for microphone response, with nearfield woofer and port responses plotted below 300Hz and 1kHz, respectively.
Moving up in frequency, the woofer's output is pretty ragged in the upper midrange before it starts to roll off above 2kHz. The initial slope is mild, and the woofer is still contributing to the overall sound as high as 7kHz. Its rollout is marred by a series of resonant peaks. The Linaeum tweeter comes in sharply above 2kHz, but on-axis at least, its output is down in level and looks very ragged.
Fig.5 shows how these individual responses add up on the tweeter axis. In the bass, a big peak appears in the upper bass—no surprise from the listening tests—while a sharp step in the woofer response at 1100Hz mars an overall even midrange balance. The entire tweeter region is shelved down by an average of 8dB. Concerned by this, I checked the second LX5 sample. The result is rather different, as can be seen in fig.6. Though the treble is still shelved down above 7kHz and broken up by a series of peaks and dips, there's now an even response trend through the mid-treble. It looks as if the first sample of the LX5, whose response is shown in fig.5, was wired with the tweeter in the wrong polarity. Not only would this give rise to a suckout in the region where the tweeter and woofer overlap, it would also explain the difference in sensitivity between the two samples and the pulling of the stereo image to one side at high frequencies.
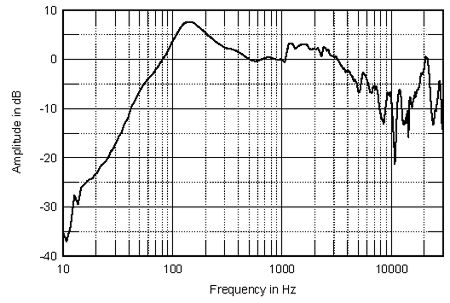
Fig.5 Optimus Pro LX5, sample 1, anechoic response on tweeter axis at 50", averaged across 30° horizontal window and corrected for microphone response, with complex sum of woofer and port responses plotted below 300Hz.
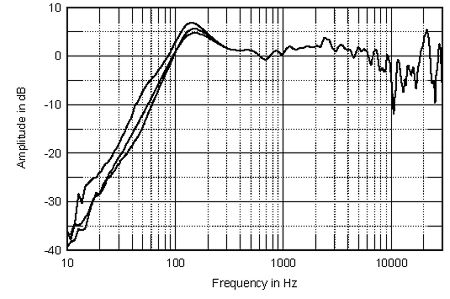
Fig.6 Optimus Pro LX5, sample 2, anechoic response on tweeter axis at 50", averaged across 30° horizontal window and corrected for microphone response. The complex sum of the woofer and port responses is plotted below 300Hz with (from top to bottom at 150Hz): ports open; each port stuffed with nine standard drinking straws; ports closed with plugs of polyurethane foam.
However, checking the step responses of all the drive-units revealed that the two samples were identical: woofers wired to give positive acoustic polarity, tweeters wired to give negative acoustic polarity—at least regarding the initial departure from the time axis. (The Linaeum tweeter's step response actually features almost as many positive-going as negative-going pulses.) In addition, despite the two samples featuring identical drive-unit polarities, mathematically summing the individual drive-unit outputs, taking phase into account, did indeed give a crossover-region suckout for the first sample and a flat response in the same region for the second. I'm at a loss, therefore, to explain the difference between the samples other than to suggest that RadioShack's quality control on the tweeter is not as good as it should be.
On the left of fig.6 are shown three bass responses: the one highest in level was taken with the ports free of any obstruction. The next one down is the response with straws in the ports: the extra air resistance usefully knocks down the peak by a couple of dB. The bottom trace, which actually crosses the "straws" response at 90Hz, is with the ports sealed. The –6dB points are 54Hz, 70Hz, and 73Hz, respectively. I was quite happy to sacrifice a little bass extension to get better upper-bass definition. If you own LX5s, it will be worth experimenting with the woofer tuning.
Part of the reason for the depressed treble exactly on the tweeter's centerline is revealed in fig.7. This graph shows the changes in response as the microphone was moved around to the speaker's side, 5° at a time. While the woofer's response drops at the top of its passband more than 30° to the side, the tweeter can be seen to actually have two main output lobes, each at approximately 30° from the center axis. As the LX5 tweeter is symmetrical front-to-back, it actually has a horizontal dispersion pattern shaped like a four-leafed clover, giving out as much sound to the rear as to the front. The speakers will give the most treble if they are not toed-in to the listening seat.
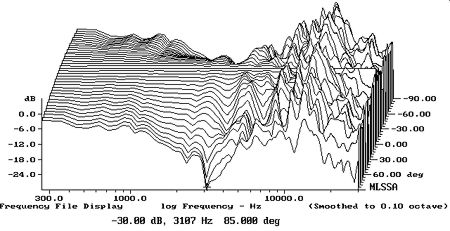
Fig.7 Optimus Pro LX5, horizontal response family at 50", normalized to response on tweeter axis, from back to front: differences in response 90°–5° off-axis; reference response; differences in response 5°–90° off-axis.
Vertically (fig.8), a notch at 2.3kHz quickly appears in the response as you move below the tweeter axis. It's best to listen to the LX5s with them sitting on low rather than high stands or bookshelves. The tweeter, however, appears to offer reasonably good treble dispersion—something I wasn't expecting from its design.
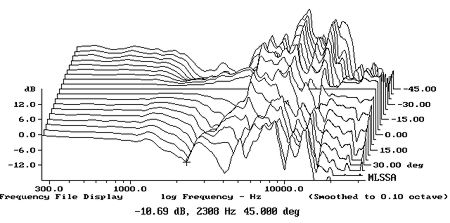
Fig.8 Optimus Pro LX5, vertical response family at 50", normalized to response on tweeter axis, from back to front: differences in response 45°–5° above tweeter axis; reference response; differences in response 5°–45° below tweeter axis.
In my listening room, the spatially averaged 1/3-octave response (footnote 1) (fig.9), taken with straws in the ports, shows only a mild rise in the upper bass, with a room mode helping to keep the low frequencies going down to the 63Hz band. The midrange is quite evenly balanced, with just a slight shelf upward noticeable at the top of the woofer's passband. The tweeter region, however, is shelved down by up to 3dB, which will contribute to the LX5's dulled tonal balance.
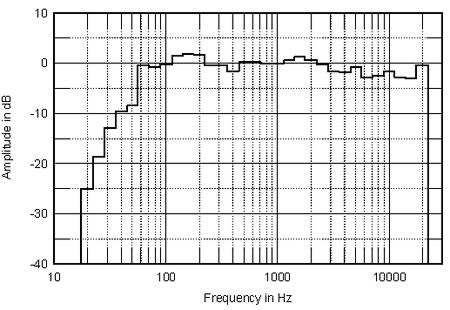
Fig.9 Optimus Pro LX5, spatially averaged 1/3-octave response in JA's listening room.
In the time domain, the LX5's impulse response (fig.10, second sample) looks time-coherent, though quite a lot of high-frequency ringing can be seen. The time coherency was confirmed by the step response (fig.11), which has an excellent right-triangle shape, despite the drivers having opposite acoustic polarities! The waterfall plot, however, looks quite hashy in the treble (fig.12), with a strong resonant mode apparent at 2.4kHz—the result of the woofer cone breaking up—which ties in with the slight nasal coloration I noted. The high frequencies are also marred by a considerable degree of stored energy. Lower in frequency, however, the initial decay in this plot looks quite clean.
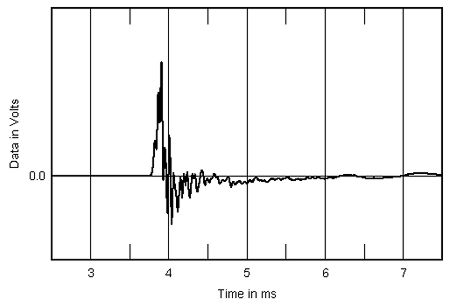
Fig.10 Optimus Pro LX5, impulse response on tweeter axis at 50" (5ms time window, 30kHz bandwidth).
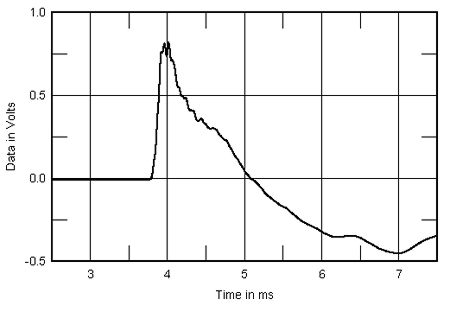
Fig.11 Optimus Pro LX5, step response on tweeter axis at 50" (5ms time window, 30kHz bandwidth).
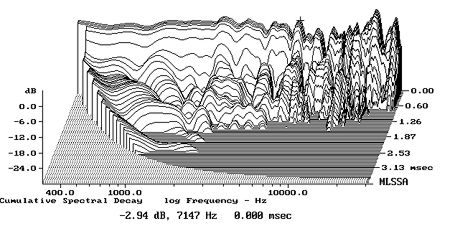
Fig.12 Optimus Pro LX5, cumulative spectral-decay plot at 50" (0.15ms risetime).
Overall, not a bad set of measurements for a speaker with a street price of $100 each.—John Atkinson
Footnote 1: For my in-room spectral analyses, I average six measurements at each of 10 separate microphone positions for left and right speakers individually, giving a total of 120 original spectra. These are then averaged to give a curve which in my room has proved to give a good correlation with a loudspeaker's perceived balance. I use an Audio Control Industrial SA-3050A spectrum analyzer with its own microphone, which acts as a check on the MLSSA measurements made with the B&K mike. I also used the Goldline DSP-30 automated spectrum analyzer (currently under review).—John Atkinson
|
| ||||||||||
- Log in or register to post comments


| Loudspeakers Amplification Digital Sources | Analog Sources Accessories Featured | Music Columns Retired Columns | Show Reports | Features Latest News Community | Resources Subscriptions |
 © 2024 Stereophile
AVTech Media Americas Inc., USA
All rights reserved

