| Columns Retired Columns & Blogs |
Quad 99 CDP-2 CD player Measurements
Sidebar 3: Measurements
I measured the Quad 99 CDP-2 using its unbalanced RCA jacks only. The Quad's maximum output from both variable and fixed outputs was 1.5dB higher than the CD standard's 2V RMS, at 2.37V. The volume control operated in accurate 1dB steps from its maximum of "32" to "23," in 2dB steps from "22" to "17," in 3dB steps from "16" to "9," in a 4dB "step" from "9" to "8" (the default level, –51dB, when the player is turned on), and in 5dB steps down to "1," with "0" being full mute. The Quad preserved absolute polarity—ie, was noninverting—and the output impedance was a low 120 ohms at 1kHz, rising slightly to 130 ohms at 20Hz and dropping slightly to 114 ohms at 20kHz. Error correction was good, the player neither muting nor lighting up the error flags in its digital output until 1.25mm gaps in the data spiral, judged using the Pierre Verany Test CD.
The player's audioband frequency response was flat (fig.1, upper pair of traces below 1kHz), but the response with pre-emphasized data (fig.1, upper traces above 2kHz) reveals that, like an annoyingly increasing number of modern players, the 99 CDP-2 doesn't apply the appropriate de-emphasis. Channel separation (fig.2) was better than 110dB below 1kHz, but decreased to a still excellent 90dB at 20kHz, due to the usual capacitive coupling between channels.
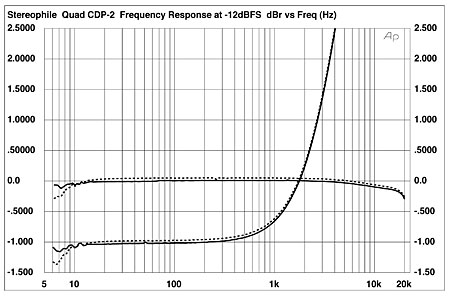
Fig.1 Quad 99 CDP-2, frequency response at –12dBFS into 100k ohms, with de-emphasis (bottom below 1kHz) and without; response (bottom above 2kHz). (Right channel dashed, 1dB/vertical div.)
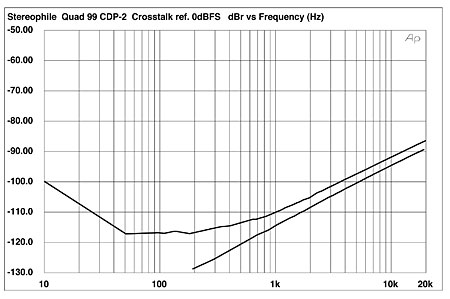
Fig.2 Quad 99 CDP-2, channel separation (10dB/vertical div.)
As the Quad player has both coaxial and optical inputs for external S/PDIF data sources, I was able to test it with data having a greater bit depth than CD's 16 and a higher sample rate than the CD's 44.1kHz. Both electrical and optical inputs locked to data with sample rates from 32kHz to 88.2kHz, but failed to produce a clean output signal with 96kHz sample-rate data, using any of the sources I had available. (Perhaps the Quad had suffered some static-induced damage on its way to my test lab? One anomaly was that even when I fed it 88.2kHz data, its display stubbornly said "44.1.") The top pair of traces in fig.3 shows 1/3-octave spectral analysis of the 99 CDP-2's analog output while it decoded 16-bit CD data representing a dithered 1kHz tone at –90dBFS. The traces peak at exactly –90dBFS and are commendably free from either harmonic distortion or power-supply spuriae. (The player seemed immune to grounding issues.) There is a suspicious-looking peak at 30Hz in both channels, but this is still very low in level.
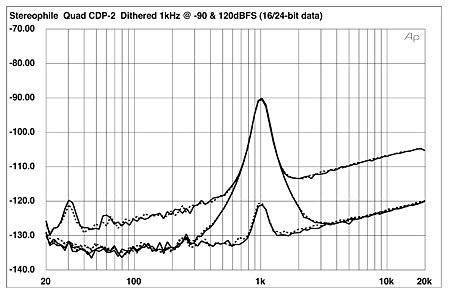
Fig.3 Quad 99 CDP-2, 1/3-octave spectrum of dithered 1kHz tone at –90dBFS, with noise and spuriae with 16-bit CD data (top) and 24-bit external data (middle), and of dithered, 24-bit/1kHz tone at –120dBFS (bottom). (Right channel dashed.)
Feeding the Quad with external 24-bit, 44.1kHz data representing the same signal gave the middle pair of traces in fig.3. The noise floor in the upper midrange and treble has dropped by up to 16dB, suggesting that the 99 CDP-2's DACs actually have close to 19-bit resolution, which is excellent performance. The player readily resolves 24-bit data representing a dithered tone at –120dBFS (fig.3, bottom traces)! Extending the measurement bandwidth to 200kHz and playing back 16-bit data representing a –1LSB DC offset (fig.4) confirmed the low audioband noise floor, but again with the small 30Hz peaks evident, and revealed a rising ultrasonic noise floor due to the DACs' noise-shaped sigma-delta topology. This rise was moderate, however, reaching –90dBFS at 200kHz.
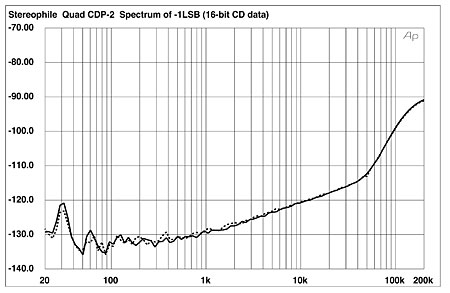
Fig.4 Quad 99 CDP-2, 1/3-octave spectrum of םLSB (16-bit CD data). (Right channel dashed.)
The low noise meant that the graph of the Quad's 16-bit linearity error (fig.5) really only shows the contribution of the dither noise present in the test signal on the CBS CD1 test CD. The player's reproduction of an undithered 16-bit sinewave at exactly –90.31dBFS (fig.6) was essentially perfect, clearly showing a symmetrical stepped wave with three well-defined DC voltage levels. Extending the bit depth to 24 gave a reasonably good-looking sinewave, even at this very low level (fig.7).
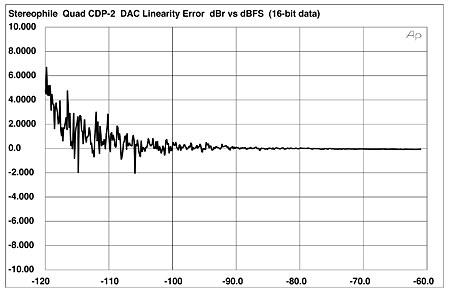
Fig.5 Quad 99 CDP-2, left-channel departure from linearity, 16-bit CD data (2dB/vertical div.).
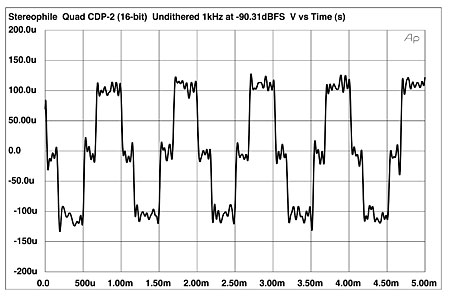
Fig.6 Quad 99 CDP-2, waveform of undithered 1kHz sinewave at –90.31dBFS, 16-bit CD data.
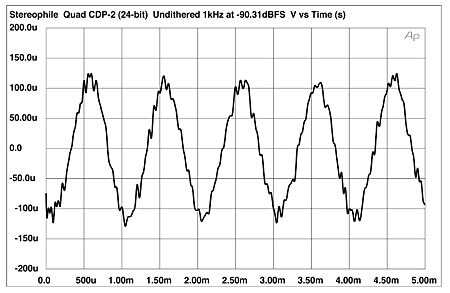
Fig.7 Quad 99 CDP-2, waveform of undithered 1kHz sinewave at –90.31dBFS, 24-bit external data.
Not only did the Quad 99 CDP-2 have low levels of noise in its output, it also had low levels of distortion, offering just 0.001% of THD with a full-scale sinewave. However, I was somewhat bothered to see the fifth and seventh harmonics highest in level (fig.8), even though these are each better than 100dB below full scale. The noise floor in this graph, by the way, is due to the analyzer, not the player, which I confirmed by looking at the spectrum of a 16-bit dithered tone at –90dBFS (fig.9). Here, only the low-order second, third, and fourth harmonics can be seen above the noise, each lying more than 35dB below the fundamental tone. Intermodulation distortion was also very low (fig.10), with no trace of aliasing components.

Fig.8 Quad 99 CDP-2, spectrum of 1kHz sinewave at 0dBFS into 8k ohms, DC–10kHz (linear frequency scale).
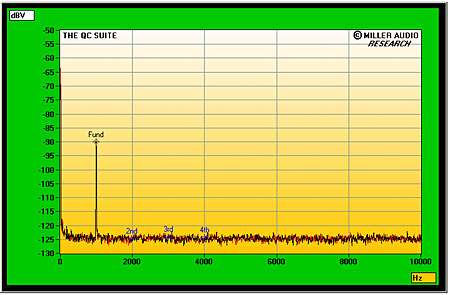
Fig.9 Quad 99 CDP-2, spectrum of 1kHz sinewave at –90dBFS into 8k ohms, DC–10kHz (linear frequency scale).
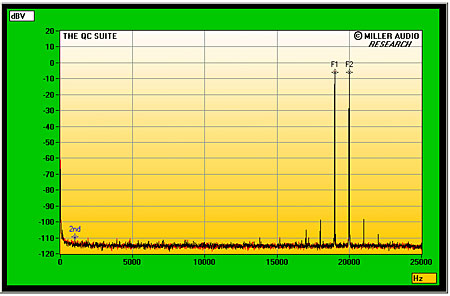
Fig.10 Quad 99 CDP-2, HF intermodulation spectrum, 19+20kHz at 0dBFS peak into 8k ohms, DC–24kHz (linear frequency scale).
Word-clock jitter for CD playback, assessed with the Miller Audio Research Analyzer, was low, at 284 picoseconds peak–peak, much of this coming from a pair of sidebands at ±15.6Hz (purple "1" numeric markers in fig.11). Data-related sidebands (red numeric markers) lie at the residual level of the signal, but there are also some higher-frequency sidebands visible in this graph; I have no idea where they stem from. The jitter level was a little higher for an external TosLink optical connection, at 333ps (16-bit data) and 380ps (24-bit data). More significant, some high-level, low-frequency sidebands appear (fig.12, purple numeric markers "1" through "6") that broaden the central peak that represents the high-level tone at exactly one quarter the sampling frequency. The noise floor also appears to be modulated by this high-frequency tone.
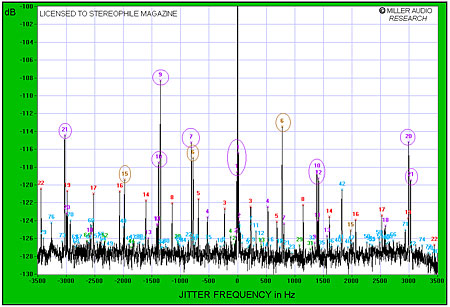
Fig.11 Quad 99 CDP-2, high-resolution jitter spectrum of analog output signal (11.025kHz at –6dBFS sampled at 44.1kHz with LSB toggled at 229Hz, 16-bit CD data). Center frequency of trace, 11.025kHz; frequency range, ±3.5kHz.
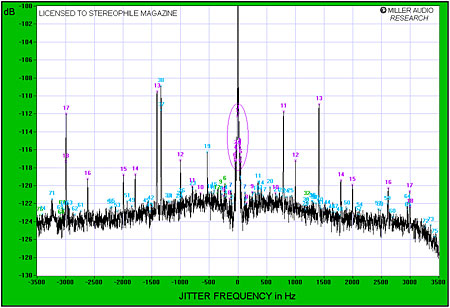
Fig.12 Quad 99 CDP-2, high-resolution jitter spectrum of analog output signal (11.025kHz at –6dBFS sampled at 44.1kHz with LSB toggled at 229Hz, 24-bit external data, TosLink connection). Center frequency of trace, 11.025kHz; frequency range, ±3.5kHz.
With the exception of its lack of de-emphasis, the Quad 99 CDP-2 pretty much offers state-of-the-art performance for CD playback at a relatively affordable price. I was less impressed by its anomalous behavior with high–sample-rate external S/PDIF data, but as Wes found no problems with a 96kHz feed, perhaps that behavior was due to a subsequent sample failure.—John Atkinson
|
| ||||||||||
- Log in or register to post comments


| Loudspeakers Amplification Digital Sources | Analog Sources Accessories Featured | Music Columns Retired Columns | Show Reports | Features Latest News Community | Resources Subscriptions |
 © 2024 Stereophile
AVTech Media Americas Inc., USA
All rights reserved

