PSB Imagine T3 loudspeaker Measurements

Sidebar 3: Measurements

I used DRA Labs' MLSSA system and a calibrated DPA 4006 microphone to measure the PSB Imagine T3's frequency response in the farfield, and an Earthworks QTC-40, which has a ¼" capsule and thus doesn't present a significant obstacle to the sound, for the nearfield frequency responses. I also used the Earthworks mike for the in-room response.

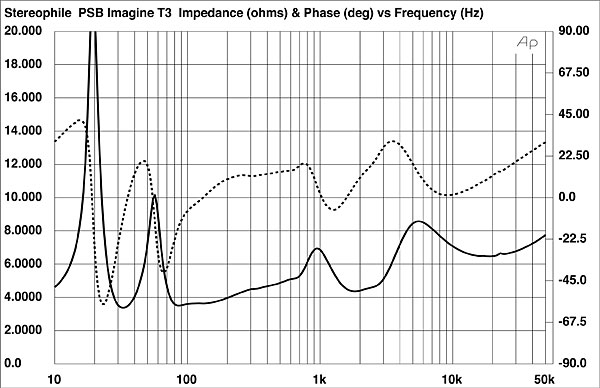
My estimate of the Imagine T3's voltage sensitivity was 89.2dB/2.83V/m, confirming the specified figure. The PSB's electrical impedance magnitude and phase are shown in fig.1. Other than in the regions between 28 and 40Hz and between 75 and 200Hz, the magnitude (solid trace) remains above 4 ohms at all frequencies. The minimum value is 3.5 ohms at 85Hz, and the phase angle (dotted trace) is generally low. Any amplifier that is comfortable driving 4 ohms will have no difficulty with the Imagine T3.

Fig.1 PSB Imagine T3, electrical impedance (solid) and phase (dashed) (5 ohms/vertical div.).

The impedance traces are free from the discontinuities that would hint at the presence of resonance. My usual accelerometer was suffering from a broken preamplifier when I did the testing, but listening to the enclosure with a stethoscope, I could hear some narrowband liveliness between 550 and 750Hz, particularly on the sidewalls level with the middle woofer.

The complicated-looking fig.2 shows the nearfield responses of the T3's midrange unit (black trace), upper woofer and port (blue), middle woofer and port (green), and bottom woofer and port (red). The three woofers do all behave somewhat differently, the bottommost having a slightly higher Quality factor (Q), and both it and the port that loads it have a sharp rolloff above 80Hz. To my surprise, it was the middle woofer that extended high enough in frequency to cross over to the midrange unit, while the top woofer rolled off above 500Hz. This is the opposite of what is written in the T3's press materials, but the two samples were the same in this respect; perhaps this is to arrange for the acoustic center of the PSB's lower-frequency output to coincide with the physical center of the three drivers. However, what concerned me much more in this graph is the high-level resonant peak at 650Hz that can be seen in the outputs of the upper two ports. The ports face away from the listener, and my listening suggested that this behavior looks worse than it sounds. But I know from his earlier designs that Paul Barton has always worked hard to eliminate port misbehavior in the midrange.

Fig.2 PSB Imagine T3, nearfield responses of: midrange unit (black), top woofer and port (blue), middle woofer and port (green), bottom woofer and port (red), all plotted in the ratios of their radiating diameters.

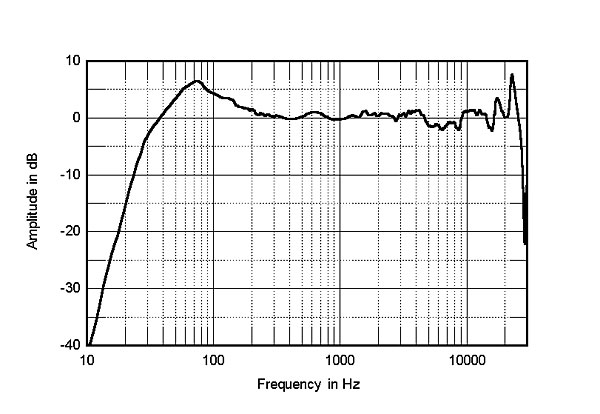
Fig.3 shows the Imagine T3's acoustic crossover, with the summed outputs of the three ports (red trace) and of the three woofers (blue). The handover from the woofers to the midrange unit (green trace) occurs closer to 800Hz than the specified 450Hz, but the high- and low-pass rolloffs are steep and symmetrical. The apparent rise in the upper bass is entirely an artifact of the nearfield measurement technique, and the output of the woofers is flat and even below the crossover point. Similarly, the outputs of the midrange unit and tweeter are generally even, though with slight excesses of energy in the presence region and the top audio octave. The same trends can be seen in the overall farfield response, averaged across a 30° horizontal window centered on the tweeter axis (fig.4).

Fig.3 PSB Imagine T3, acoustic crossover on tweeter axis, corrected for microphone response, with farfield responses of midrange-and-tweeter and woofers, with summed nearfield responses of ports and woofers.

Fig.4 PSB Imagine T3, anechoic response on tweeter axis at 50", averaged across 30° horizontal window and corrected for microphone response, with complex sum of nearfield responses plotted below 300Hz.

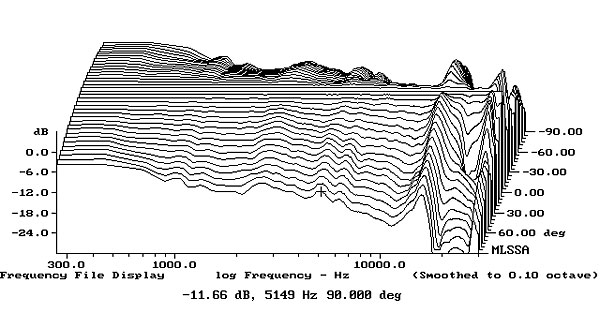
The Imagine T3's plot of lateral dispersion, normalized to the tweeter-axis response (fig.5), offers evenly spaced contour lines with the usual narrowing of the radiation pattern in the top two octaves of the tweeter's passband. The vertical dispersion, again referenced to the response on the tweeter axis (fig.6), which is 37" from the floor, suggests that the T3's balance doesn't appreciably change over quite a wide window. This does not correlate with what I heard, however. A suckout just below 900Hz appears 10° below the tweeter axis, which again suggests that the crossover between the woofers and the midrange unit occurs higher than the specified 450Hz.

Fig.5 PSB Imagine T3, lateral response family at 50", normalized to response on tweeter axis, from back to front: differences in response 90–5° off axis, reference response, differences in response 5–90° off axis.

Fig.6 PSB Imagine T3, vertical response family at 50", normalized to response on tweeter axis, from back to front: differences in response 15–5° above axis, reference response, differences in response 5–10° below axis.

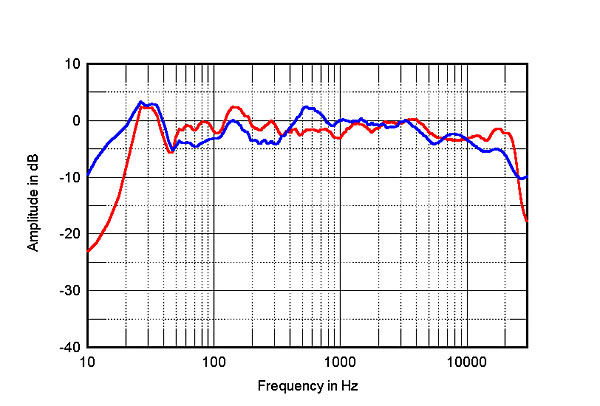
The Imagine T3's spatially averaged response at the listening position in my room (fig.7, red trace) is extremely even from the midbass through to the mid-treble, above which it shelves down due to the increasing absorptivity of the room's furnishings. The bottom port of both speakers was blocked for this measurement, but there is still a residual peak evident between 25 and 35Hz, which is due to the lowest-frequency diagonal room mode. This peak can also be seen in the spatially averaged response of the Vandersteen Model Seven Mk.II, which I reviewed in the May issue. With its powered woofers, the Vandersteen extends lower in frequency, while having less upper-bass energy but more midrange energy in-room than the PSB. The two speakers match closely in the treble, however.

Fig.7 PSB Imagine T3, spatially averaged, 1/6-octave response in JA's listening room (red) and of Vandersteen Model 7 Mk.II (blue).

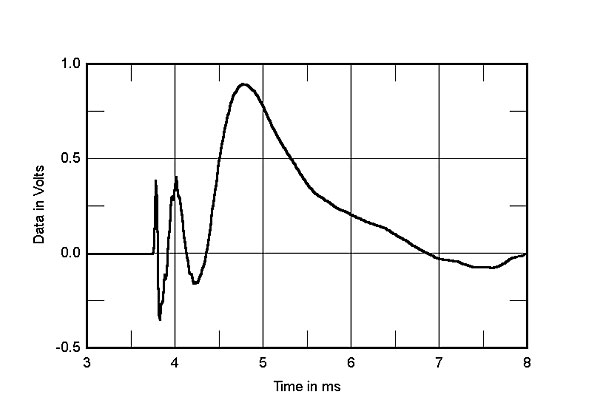
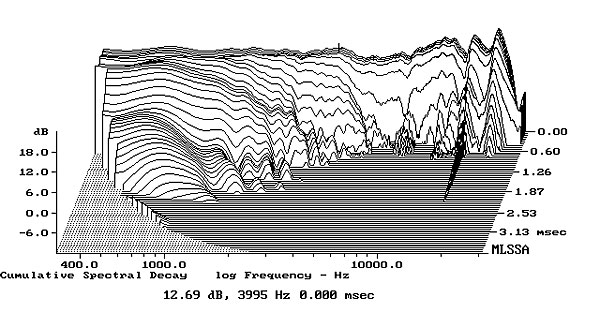
In the time domain, the Imagine T3's step response on the tweeter axis (fig.8) shows that all five drive-units are connected in positive acoustic polarity, and that the crossover filters have been optimally designed. The T3's cumulative spectral-decay plot (fig.9) demonstrates a clean decay in the region covered by the tweeter.

Fig.8 PSB Imagine T3, step response on tweeter axis at 50" (5ms time window, 30kHz bandwidth).

Fig.9 PSB Imagine T3, cumulative spectral-decay plot on tweeter axis at 50" (0.15ms risetime).

As always with a Paul Barton design, PSB's Imagine T3 demonstrates excellent speaker engineering, though I was bothered by the midrange port resonance and the disparity between the measured and the specified crossover frequencies.— John Atkinson

COMPANY INFO
PSB Speakers International
633 Granite Court
Pickering, Ontario L1W 3K1
Canada
(905) 831-6555
ARTICLE CONTENTS

COMMENTS
audiodoctornj's picture

We here at Audio Doctor, www.audiodoctor.com, would like to thank John Atkinson for such a nice review of a product we love!

Audio Doctor, has one of the largest collections of high end audio on the East Coast, and we sell many different brands of High End loudspeakers, including Dali, Paradigm, KEF,KEF Reference, KEF Blades, Polymer Audio, Jantzen,Tannoy, Cabasse,and others.

We ordered our demo pair of the T3's, without ever hearing them, based on some positive rumors that the speakers were extremely good, and were comparable to much, much, more expensive loudspeakers.

We also had positive experiences with the previous PSB Syn Ones which were excellent, however on comparison, the PSB T3 were in a totally different league!

The PSB T3's tweeter although it looks to be identical, is actually far cleaner with more extension and sweetness over the earlier incarnation of this tweeter.

The PSB's midrange is also cleaner, and the entire speaker's sound stage is considerably larger.

The bass of the PSB T3 is awesome, deep, tight, and prodigious!

If you look at how much speaker you get with the T3, it is clear that you have to spend $5,000.00-$7,000.00 over the cost of the T3's, to really move into a higher class of speaker one that will be actually better and better by degree.

To say that the T3 is revelation, and a bargain for the price, is an under statement.

Many people would never think that a PSB product could be listed as a true reference and compete with the world's best loudspeakers man you would be so wrong!

Paul Barton has done it again, he has raised the bar for affordable reference speakers, we have found that a pair of the PSB T3's, with good electronics, and a good source, will give you one hell of sound!
Anon2's picture

Our friends from the north seem to have some solid offerings with their Paradigm and PSB speaker products.

What happened to the Synchrony line of PSB speakers? I recall that they had a couple of stand-mount models, both of which disappeared from the company's website. If I recall one of these Synchrony stand-mounts had 5.75" or so woofer; the other a 6.5" or 7" woofer.

These products, again by my recollection, had interesting looking drivers (some sort of woven fiberglass), a nice fit and finish, and had a very solid billed weight. Will this Imagine line come with some successor products of sorts to those two discontinued Synchrony stand-mounts?

Allen Fant's picture

Nicely done- JA. Happy Listening!

Axiom05's picture

Hello JA. I have seen you refer to the "lowest-frequency diagonal room mode" in many of your speaker reviews. Would you please elaborate on this and define exactly what this is? I have never heard of a diagonal room mode before and none of the room mode calculators that I use mention this specifically. I would also be interested in learning what steps you have used to try to control this mode (difficult due to the long wavelength involved). Thanks!

smileday's picture

I see very complicated dips and peaks in 1/48 oct smoothed curve. I cannot explain them using the simple standing wave modes between parallel walls of rectangular box.

I am wondering how successful the room mode calculators were in your listening room.

Axiom05's picture

I have found that room mode calculators are of limited help. This is probably due to the presence of windows, doors, closets, different construction materials within room, on and on. I have an unexplainable large peak at 38 Hz which is not listed in any room calculation based on primary, tangential, and oblique modes, thus leading to my question.

smileday's picture

Sorry. Blocked comment test.

smileday's picture

Sorry again. I am doing this test because my real comment is blocked in Stereophile's Bose review page right after I posted a test comment on that page.

tm1070's picture

Not to knock these things, as I am sure they are excellent, but I do miss reading the PSB site in the '90s when PSB described Stratus Gold (paraphrasing) "the best we know how to do for ~$2100". I am sure this Imagine T3 is good deal relatively speaking, but it's pretty expensive. This feels pretty corporate to me.

X