| Columns Retired Columns & Blogs |
Prism Sound Callia D/A headphone amplifier Measurements
Sidebar 3: Measurements
Footnote 1: My thanks for Jürgen Reis for suggesting this test to me.
I measured the Prism Sound Callia with my Audio Precision SYS2722 system (see the January 2008 As We See It"), using both the Audio Precision's optical and electrical digital outputs and USB data sourced from my MacBook Pro running on battery power with Pure Music 3.0 playing WAV and AIFF test-tone files. Apple's USB Prober utility identified the DAC as "Callia" from "Prism Media Products, Ltd.," its serial number as "000001," and confirmed that its USB port operated in the optimal isochronous asynchronous mode. Apple's AudioMIDI utility revealed that, via USB, the Callia accepted 32-bit integer data and identified the clock source as "CleverClox." The optical and coaxial S/PDIF inputs accepted datastreams with sample rates up to 192kHz, and the USB 2.0 input accepted streams sampled up to 384kHz as well as DSD.
The maximum output level at 1kHz was 3.88V from the balanced outputs, 1.99V from the unbalanced outputs, and 1.93V from the headphone outputs, as set up for my listening. All outputs preserved absolute polarity. (The XLR jacks are wired with pin 2 hot.) The output impedance conformed to specifications: 50 ohms from both sets of line outputs, 4.5 ohms from the headphone outputs.
The reconstruction filter's impulse response (fig.1) indicated that it is almost a minimum-phase type, with almost all the ringing occurring after the single sample at 0dBFS. The filter rolled off rapidly above half the sampling frequency with white noise sampled at 44.1kHz (fig.2, magenta and red traces, footnote 1), and reached the full stop-band suppression at 24kHz. Consequently, the aliased image of a full-scale 19.1kHz tone (cyan and blue traces) was suppressed by >100dB. Though the distortion harmonics of this tone are very low in level—the third harmonic is the highest in level, at –91dB (0.003%)—some enharmonic tones are present in the spectrum, though also at very low levels.
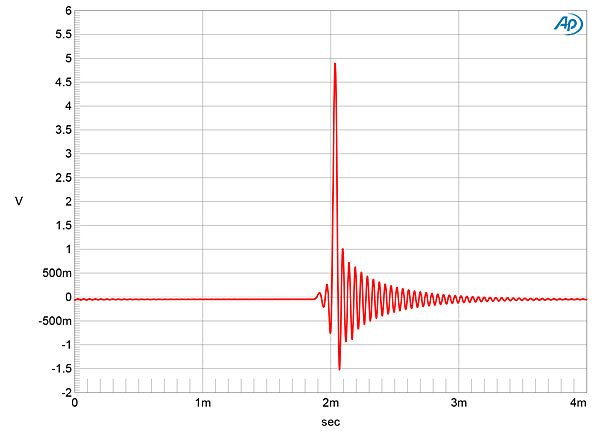
Fig.1 Prism Sound Callia, impulse response (one sample at 0dBFS, 44.1kHz sampling, 4ms time window).
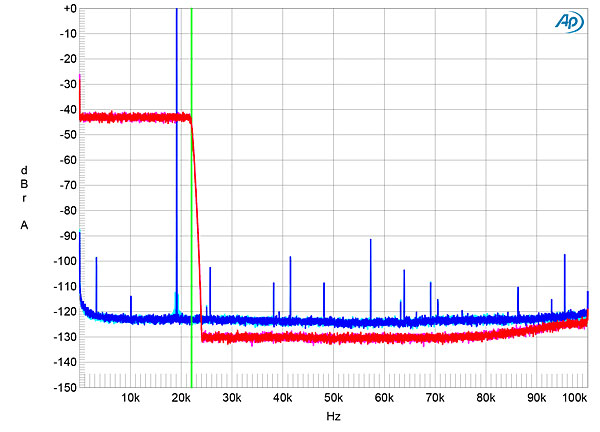
Fig.2 Prism Sound Callia, wideband spectrum of white noise at –4dBFS (left channel red, right magenta) and 19.1kHz tone at 0dBFS (left blue, right cyan), with data sampled at 44.1kHz (20dB/vertical div.).
Fig.3 shows the Callia's frequency response with data sampled at 44.1, 96, and 192kHz. With the lower sample rates, the DAC's output drops rapidly below each Nyquist frequency (half the sample rate); with 192kHz data, the output is down by 6dB at Nyquist. I haven't shown the frequency response with 384kHz data, as it overlay the response at 192kHz. As Prism Sound says, the DAC downsamples data sampled at rates greater than 192kHz. Channel separation was greater than 120dB below 2kHz, and still 110dB in both directions at the top of the audioband. The Callia produced low levels of analog noise. While spuriae at the power-supply–related frequencies of 120, 240, and 360Hz were present (fig.4), these were vanishingly low in level.
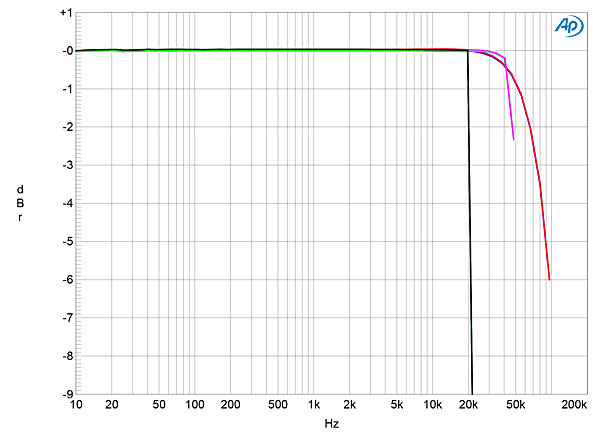
Fig.3 Prism Sound Callia, frequency response at –12dBFS into 100k ohms with data sampled at: 44.1kHz (left channel green, right gray), 96kHz (left cyan, right magenta), 192kHz (left blue, right red) (1dB/vertical div.).
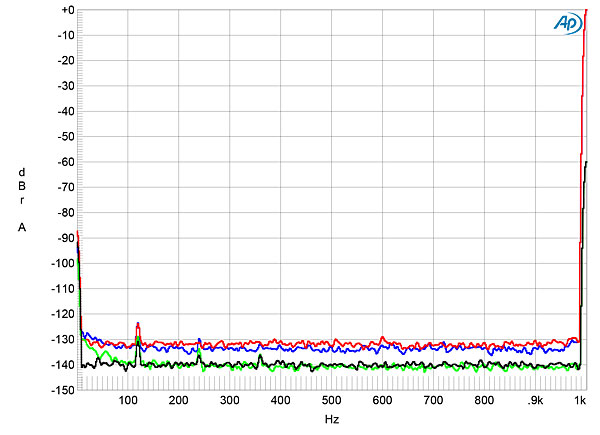
Fig.4 Prism Sound Callia, spectrum with noise and spuriae of 1kHz tone at: 0dBFS (left channel blue, right red), –60dBFS (left green, right gray) (20dB/vertical div.).
When I increased the bit depth from 16 to 24 with a dithered 1kHz tone at –90dBFS (fig.5) the noise floor dropped by 12dB, meaning that the Callia offers 18 bits' worth of resolution. With undithered data representing a tone at exactly –90.31dBFS (fig.6), the three DC voltage levels described by the data were well resolved. With undithered 24-bit data the result was a fairly clean sinewave (fig.7).
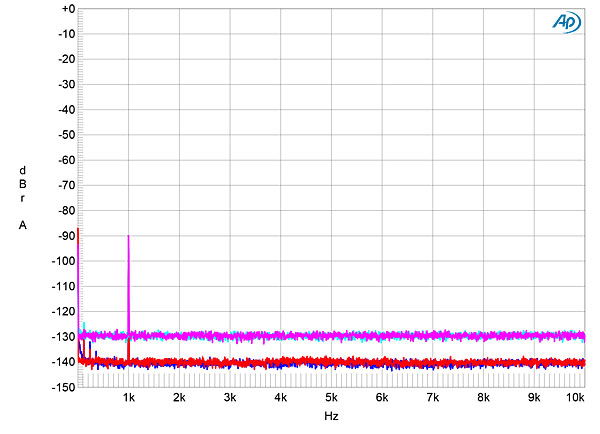
Fig.5 Prism Sound Callia, spectrum with noise and spuriae of dithered 1kHz tone at –90dBFS with: 16-bit data (left channel cyan, right magenta), 24-bit data (left blue, right red) (20dB/vertical div.).
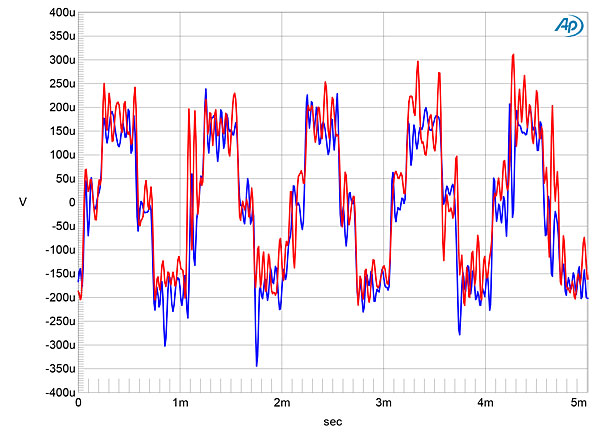
Fig.6 Prism Sound Callia, waveform of undithered 1kHz sinewave at –90.31dBFS, 16-bit TosLink data (left channel blue, right red).
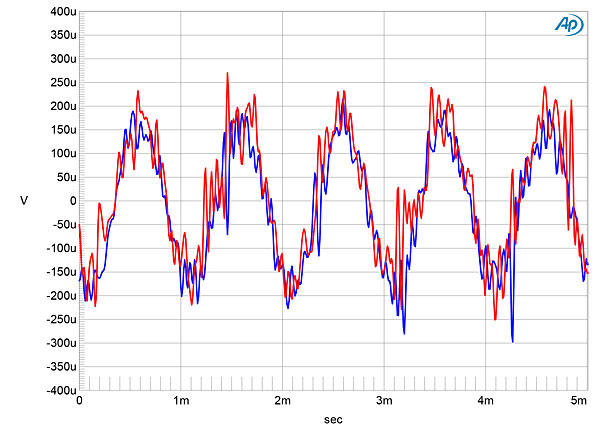
Fig.7 Prism Sound Callia, waveform of undithered 1kHz sinewave at –90.31dBFS, 24-bit TosLink data (left channel blue, right red).
As suggested by fig.2, harmonic distortion was very low. Even at maximum output into the punishingly low 600 ohm load, the second and third harmonics lay at just –104dB (0.0006%) and –109dB (0.0004%), respectively (fig.8). Low-order intermodulation distortion was also vanishingly low (fig.9), though to my surprise, pairs of sidebands around the primary tones and some very high-order products are both visible in this graph. These are all very low in level, however.
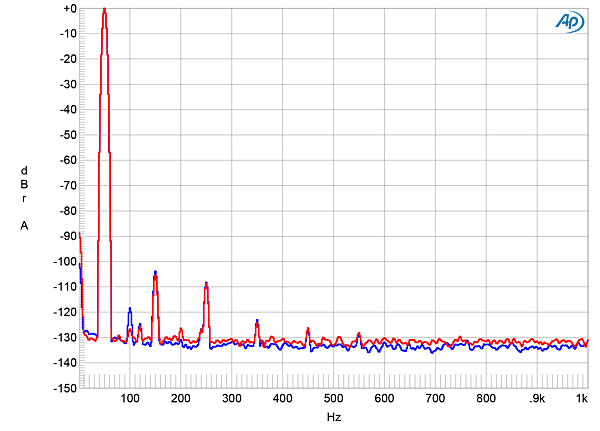
Fig.8 Prism Sound Callia, spectrum of 50Hz sinewave, DC–1kHz, at 0dBFS into 600 ohms (left channel blue, right red; linear frequency scale).
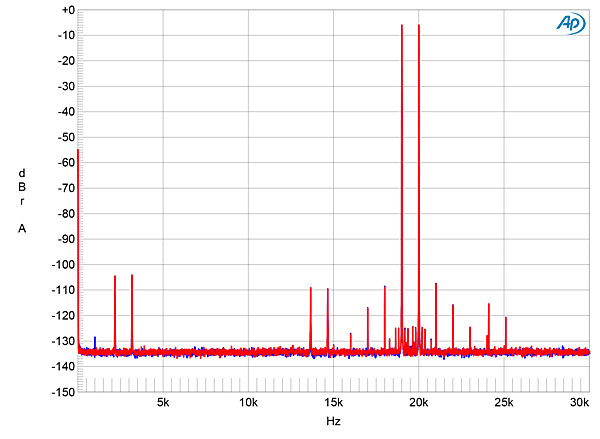
Fig.9 Prism Sound Callia, HF intermodulation spectrum, DC–30kHz, 19+20kHz at 0dBFS into 600 ohms, 44.1kHz data (left channel blue, right red; linear frequency scale).
When I tested the Callia for its rejection of word-clock jitter, using undithered 16-bit J-Test data (footnote 2) fed to the coaxial S/PDIF input, I was not surprised to find that the odd-order harmonics of the low-frequency, LSB-level squarewave were all at the correct levels, as shown by the sloping green line in fig.10. What I was not expecting were the sidebands at 180 and 360Hz to either side of the spectral spike that represents the tone at one-quarter the same rate. I repeated the test with the TosLink and USB inputs, and with 48kHz J-Test data, and experimented with grounding between the DAC and the Audio Precision, as well as with other sample rates—all to no avail. Fig.11 shows the spectrum with 24-bit J-Test data: the sidebands are clearly revealed. But these are at a low level, and disappeared when I reduced the level of the input data by 6dB.
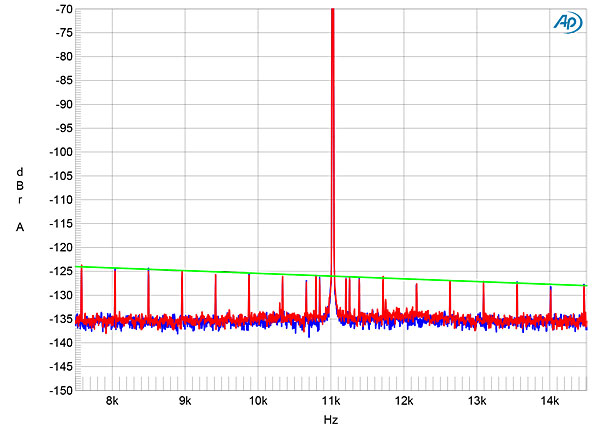
Fig.10 Prism Sound Callia, high-resolution jitter spectrum of analog output signal, 11.025kHz at –6dBFS, sampled at 44.1kHz with LSB toggled at 229Hz: 16-bit coaxial S/PDIF data (left channel blue, right red). Center frequency of trace, 11.025kHz; frequency range, ±3.5kHz.
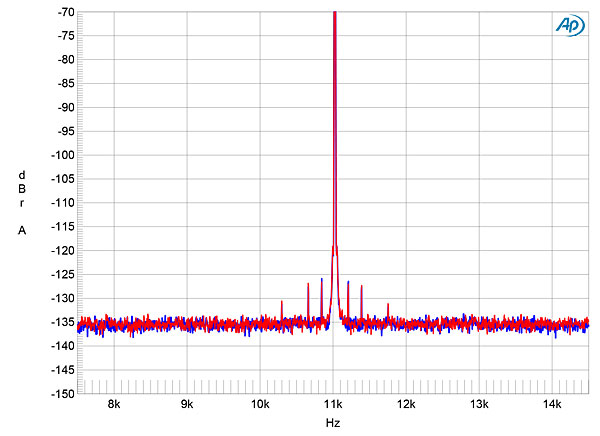
Fig.11 Prism Sound Callia, high-resolution jitter spectrum of analog output signal, 11.025kHz at –6dBFS, sampled at 44.1kHz with LSB toggled at 229Hz: 24-bit coaxial S/PDIF data (left channel blue, right red). Center frequency of trace, 11.025kHz; frequency range, ±3.5kHz.
The frequencies of the sideband pairs suggest that they might berelated to the power supply. The question then becomes: Are they due to jitter or to something else, such as inadequate supply filtering on the DAC chip's voltage-reference pin? To find out which, I performed spectral analyses with full-scale tones at 20, 15, 10, and 5kHz. The results are shown in fig.12: you can see that as the frequency of the tone decreases, so do the levels of the sidebands, which means they are jitter related.
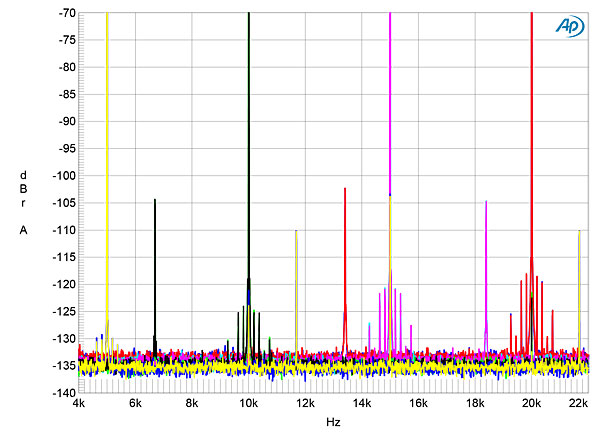
Fig.12 Prism Sound Callia, high-resolution spectrum of 0dBFS tones at: 20kHz (left channel blue, right red), 15kHz (left cyan, right magenta), 10kHz (left green, right gray), 5kHz (left gray, right yellow) (10dB/vertical div.).
Of more concern in this graph is the presence of spurious enharmonic tones that are much higher in level than the sidebands. The 20kHz tone was accompanied by a tone at 13.55kHz, 15kHz by a tone at 18.55kHz, 10kHz by 6.8kHz, and 5kHz by tones at 11.95 and 21.9kHz. This graph was taken with data sampled at 44.1kHz, so I repeated the test with data sampled at 48kHz. This time the spectra were free from any spurious tones. The tones reappeared with 88.2 and 176.4kHz data, though at different frequencies from the 44.1kHz data, but were absent with 96 and 192kHz data. Predicting the subjective effect of this behavior is difficult—the spurious tones are all down by at least 100dB from full scale—but clearly, something is not quite right with how the Callia handles 44.1kHz-related sample-rate data compared with 48kHz-family data.
Other than that problem, the Prism Sound Callia offers respectable measured performance. Still, I was puzzled by the appearance of the jitter-related sidebands, given Prism's emphasis on jitter rejection, as stated in the Callia's manual.—John Atkinson
Footnote 1: My thanks for Jürgen Reis for suggesting this test to me.
Footnote 2: One of the developers of this diagnostic test signal, Julian Dunn, joined Prism Sound in 1989 as a staff engineer. He died from leukemia on January 23, 2003, aged just 41. See www.nanophon.com/tributes/JAES_V51_4_PG290.pdf.
|
| ||||||||||
- Log in or register to post comments


| Loudspeakers Amplification Digital Sources | Analog Sources Accessories Featured | Music Columns Retired Columns | Show Reports | Features Latest News Community | Resources Subscriptions |
 © 2024 Stereophile
AVTech Media Americas Inc., USA
All rights reserved

