| Columns Retired Columns & Blogs |
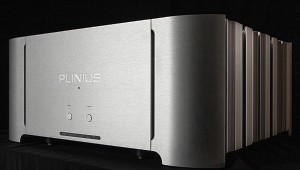
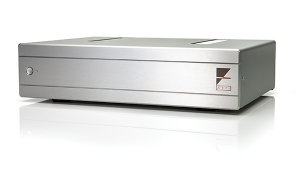
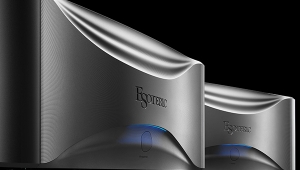
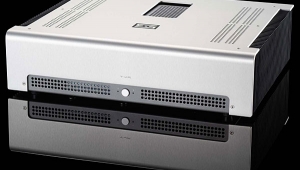
Plinius SA-Reference power amplifier Measurements
Sidebar 3: Measurements
With both balanced and unbalanced inputs and the capability of being switched on the fly between class-AB and class-A output-stage operation—I would prefer to say "high-bias current" rather than "class-A," as the amplifier does not operate in true class-A up to its specified output power in this mode—the Plinius SA-Reference offers a lot of variety for measurement options. I did a full set of measurements in balanced, class-A mode, with spot checks in unbalanced and class-AB operation.
I preconditioned the amplifier by running both channels at one-third the measured clipping power in class-A into 8 ohms for one hour. The heatsinks were hot at the end of this period, but not so hot that I couldn't keep my hand on them, implying a temperature around 55°C. The SA-Reference didn't invert signal polarity with either unbalanced or balanced drive, the latter being wired with pin 2 of the XLR input jack "hot." The unbalanced voltage gain into 8 ohms was higher than average, at 31.3dB, and wasn't any higher for balanced drive, despite the 6dB difference in specified gains. This highish gain meant that the signal/noise ratio (ref. 1W into 8 ohms), even with the grounding optimized, was a little lower than usual, at 65.2dB. This is a wideband, unweighted figure; switching in an A-weighting network improved the ratio to a good 86.4dB.
The unbalanced input impedance was 47k ohms, as specified, over most of the audioband, dropping slightly but probably inconsequentially to 38k ohms at 20kHz. The balanced input impedance was 62k ohms from 20Hz to 20kHz. The output impedance (including 6' of speaker cable) was moderately high for a solid-state design, at 0.23 ohm at 20Hz and 1kHz, increasing very slightly to 0.26 ohm at 20kHz.
The interaction between this output impedance and our standard simulated speaker load results in frequency-response variations of ±0.25dB (fig.1, top trace at 2kHz). But note also the channel imbalance in this graph: the right channel is 0.15dB higher in level into 8 ohms and 0.25dB higher into 4 ohms, suggesting it has a slightly lower source impedance than the left channel. The HF response starts to roll off at the top of the audioband, reaching –0.7dB at 20kHz and –3dB at 52.5kHz. This was for balanced drive; with unbalanced drive, the –3dB point rose slightly, to 64kHz. Either way, the Plinius' 10kHz squarewave response showed a slight rounding of its leading edges (fig.2). Channel separation (fig.3) was excellent in the midrange at >94dB (L–R) and >86dB (R–L). It decreased at higher frequencies due to the usual capacitive coupling, but was a still-good 72dB at 20kHz.
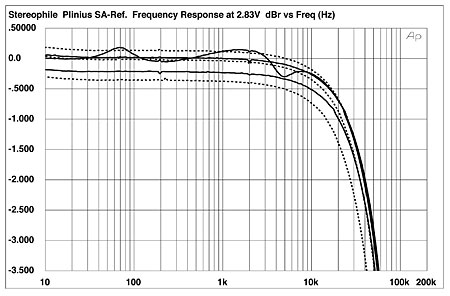
Fig.1 Plinius SA-Reference, balanced frequency response at 2.83V into (from top to bottom at 2kHz): simulated loudspeaker load, 8, 4, 2 ohms (0.5dB/vertical div., right channel dashed).
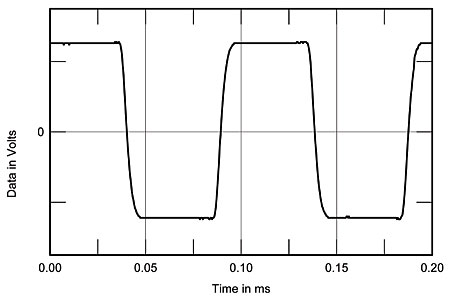
Fig.2 Plinius SA-Reference, small-signal 1kHz squarewave into 8 ohms.
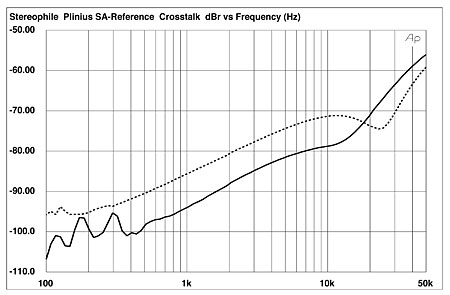
Fig.3 Plinius SA-Reference, balanced channel separation (10dB/vertical div., R–L dashed).
Even in class-A mode, the SA-Reference slightly exceeded its specified output power at 1% THD+noise, both channels driven at 1kHz, giving 320W into 8 ohms (25dBW) and 480W into 4 ohms (23.8dBW). With one channel driven, the Plinius delivered 740W into 2 ohms (22.7dBW). How the THD+N percentage changed with output power into these loads is shown in fig.4; the amplifier is clearly less comfortable with the 2 ohm load, though the additional distortion is still well below 0.1% up to the clipping point.
Fig.4 was taken with balanced drive. Remaining with balanced drive, fig.5 shows how the THD+N percentage changes with frequency into 8, 4, and 2 ohms at a level of 15V RMS, which is where the distortion starts to rise out of the noise floor, according to fig.4. Though the overall distortion levels are in the main respectably low, the amplifier clearly gets less linear as the output current and frequency increase. This graph was taken with class-A output-stage bias; switching to class-AB increased the 8 ohm midrange THD+N figure from 0.004% in both channels to 0.005% left and 0.0085% right. Switching then to unbalanced drive increased the THD further, to 0.03% left and 0.015% right. None of these figures represents anything close to audible, but they do reveal some inconsistencies in the SA-Reference's fundamental linearity.
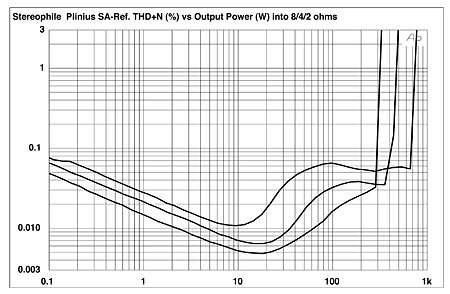
Fig.4 Plinius SA-Reference, class-A operation, distortion (%)vs 1kHz continuous output power into (from bottom to top at 1W): 8, 4, 2 ohms.
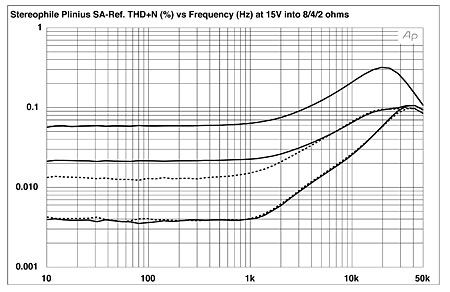
Fig.5 Plinius SA-Reference, class-A operation, THD+N (%)vs frequency at 15V into (from bottom to top): 8, 4, 2 ohms (right channel dashed).
The nature of the distortion, however, is predominantly the subjectively benign third harmonic (fig.6), even at high powers (fig.7). This spectrum was not significantly affected by switching the output-stage bias to class-AB. Only when it came to high-frequency intermodulation did the Plinius falter very slightly, the 1kHz difference component lying at –66dB (0.05%) with the amplifier in class-AB mode driving an equal mix of 19kHz and 20kHz tones into 4 ohms just below visible waveform clipping on the oscilloscope (fig.8).
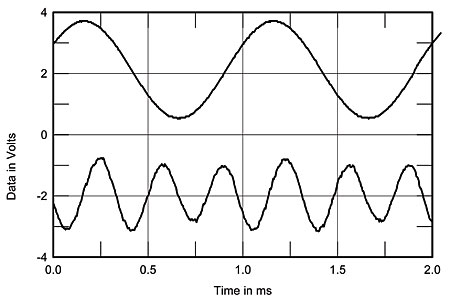
Fig.6 Plinius SA-Reference, class-A operation, 1kHz waveform at 28.4W into 4 ohms (top), 0.013% THD+N; distortion and noise waveform with fundamental notched out (bottom, not to scale).
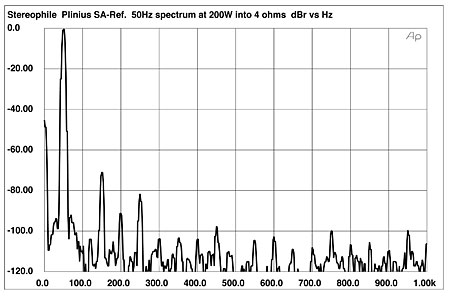
Fig.7 Plinius SA-Reference, class-A operation, spectrum of 50Hz sinewave, DC–1kHz, at 200W into 4 ohms (linear frequency scale).
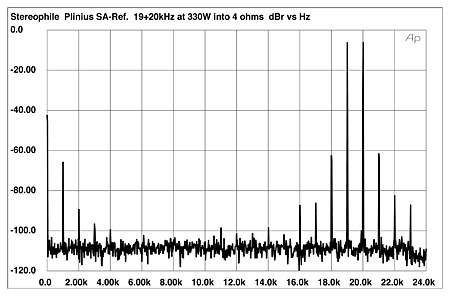
Fig.8 Plinius SA-Reference, class-AB operation, HF intermodulation spectrum, DC–24kHz, 19+20kHz at 330W peak into 4 ohms (linear frequency scale).
Other than that and my quibble over differences between the two channels' fundamental behaviors, the Plinius SA-Reference offers very good measured performance.—John Atkinson
|
| ||||||||||
- Log in or register to post comments


| Loudspeakers Amplification Digital Sources | Analog Sources Accessories Featured | Music Columns Retired Columns | Show Reports | Features Latest News Community | Resources Subscriptions |
 © 2024 Stereophile
AVTech Media Americas Inc., USA
All rights reserved

