| Columns Retired Columns & Blogs |
Platinum Audio Solo loudspeaker Measurements
Sidebar 3: Measurements
Footnote 1: Because the altitude at Santa Fe reduces the sensitivity of all loudspeakers, I calculate sensitivity by comparing the measured, B-weighted level at 50" for a given voltage input, using a noise signal, with that obtained for a sample Rogers LS3/5A that I've measured both in Santa Fe and at sea level.
The Platinum's plot of impedance magnitude and phase (fig.1) reveals it to be basically an 8 ohm load, with drops to 5 ohms or just below in the lower midrange and mid-treble. The tuning of the twin ports is revealed by the impedance minimum at 44Hz. As I found in my auditioning, however, the Solo is not very sensitive, 2.83V rising just 83.5dB (B-weighted) at 1m (footnote 1). Phil Jones has obviously decided to trade off sensitivity against bass extension (see later). No resonances make themselves known by causing wrinkles in the impedance curves, but a single strong mode could be detected with a stethoscope at 500Hz on all the Solo's panels. This is probably high enough in frequency not to have an effect on music. (As Shannon Dickson explains elsewhere in this issue, the higher in frequency a resonant mode is, the smaller its displacement.)
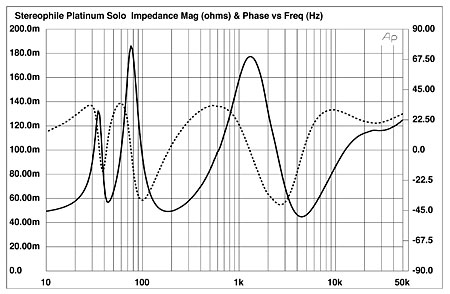
Fig.1 Platinum Solo, electrical impedance (solid) and phase (dashed) (2 ohms/vertical div.).
Fig.2 shows the response of the individual drive-units with the speaker grille removed, together with the outputs of the woofer and open port measured in the nearfield (footnote 2). The woofer has the expected notch in its response at the port tuning frequency, with the port's passband sharply peaking at almost the same frequency: around 40Hz. Though each port had a sharp peak in its output at 930Hz, which could be heard on pink noise if you stood behind the speaker, this was only moderately high in level and could not be heard from in front of the speaker. Chuffing wind noises could be heard from the ports when the speaker was fed a moderately high-level sinewave at 39Hz. Again, though, this was generally not evident on music (Stanley Clarke at mondo levels excepted).
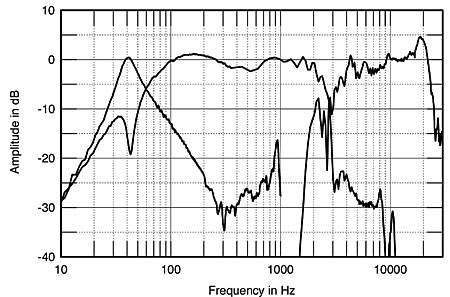
Fig.2 Platinum Solo, acoustic crossover on tweeter axis at 50", corrected for microphone response, with nearfield woofer and port responses plotted below 300Hz and 1kHz, respectively.
The in-band responses of both woofer and tweeter can be seen to be generally even-balanced, though both have some response ripples evident in the mid-treble. These are probably due to reflections from the "lips" of the enclosure top and bottom plates. I suspect that some of the crossover filters are based on some kind of notch filter, as both drive-units feature very steep rollout slopes.
How these individual responses sum at a microphone distance of 50" is shown in fig.3. An overall flat, smooth curve is broken by a slight lack of energy in the crossover region. Looking at the way in which the two curves in fig.2 combine, this appears to be due to a slight mistuning of the crossover (in that the drive-units start to roll off a little early) rather than to phase cancellation on this particular measurement and listening axis. This measurement was made with the grille on and averaged across a 30° horizontal window. Without the grille (not shown), the treble output is actually smoother above 10kHz but rises through the top octave—again, see fig.2—rather than the twin-peaked curve seen here.
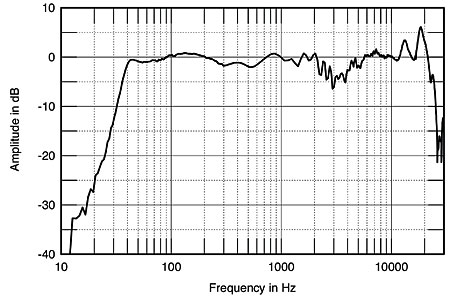
Fig.3 Platinum Solo, anechoic response on tweeter axis at 50", averaged across 30° horizontal window and corrected for microphone response, with complex sum of nearfield woofer and port responses plotted below 300Hz.
In the bass, the outputs of the woofer and twin ports combine to give what appears to be a maximally flat response shape, with a –6dB point of 35Hz—significantly lower in frequency than the larger Acoustic Energy AE2, though the price paid is reduced sensitivity.
Looking at the manner in which the Solo's response changes to the speaker's sides (fig.4), it can be seen that the on-axis suckout fills in off-axis, which will result in a flat perceived treble balance in a typical room. This is a good example of the loudspeaker designer's art: Had he chosen to go for a flat on-axis target response, the off-axis treble "horns" would have resulted in a balance that would have been too bright. The apparent off-axis peaks in the high treble in fig.4 are also due to on-axis suckouts filling to the speaker's sides. This can also be seen in the Solo's vertical dispersion plot (fig.5). This graph also confirms that the choice of vertical listening axis is quite critical, a deep suckout appearing at the 2.5kHz crossover frequency if you sit more than 10° above or below the tweeter axis.
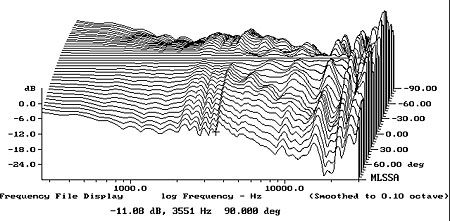
Fig.4 Platinum Solo, horizontal response family at 50", normalized to response on tweeter axis, from back to front: differences in response 90°–5° off-axis; reference response; differences in response 5°–90° off-axis.
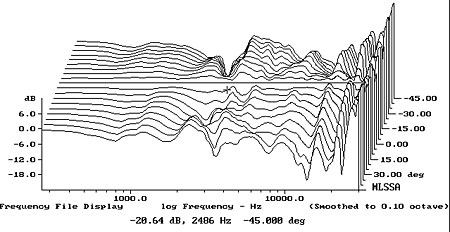
Fig.5 Platinum Solo, vertical response family at 50", normalized to response on tweeter axis, from back to front: differences in response 45°–5° above tweeter axis; reference response; differences in response 5°–45° below tweeter axis.
Fig.6 shows that in my listening room the balance is basically flat (footnote 3), but with slight lacks of energy in both the lower mids and in the crossover region. The latter will make the speaker sound a little polite; it also reveals that the filling-in of the on-axis suckout is not as efficient as it could have been. But look at the lows! Verifying my small-room/small-speaker thesis even more than the Acoustic Energies or B&Ws, the Solos in-room are flat down to 32Hz, and even make a brave try at reproducing the 25Hz band!
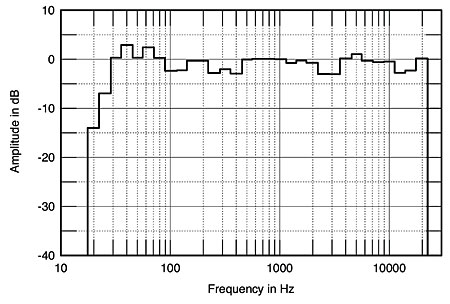
Fig.6 Platinum Solo, spatially averaged, 1/3-octave response in JA's room.
In the time domain, the step response (fig.7) indicates that the Platinum speaker is not time-coherent. As well as the tweeter being connected in inverted acoustic polarity while the woofer has a conventional positive polarity, the woofer output follows the tweeter by about 0.4ms. The waterfall plot (fig.8) is generally clean, though a slight ridge of delayed energy can be found at the 4.3kHz cursor position.—John Atkinson
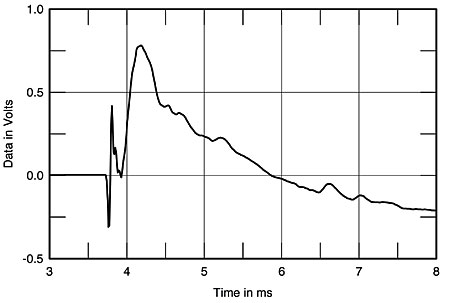
Fig.7 Platinum Solo, step response on tweeter axis at 50" (5ms time window, 30kHz bandwidth).
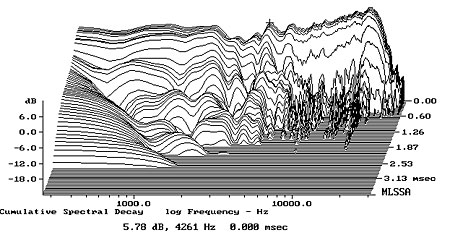
Fig.8 Platinum Solo, cumulative spectral-decay plot at 50" (0.15ms risetime).
Footnote 1: Because the altitude at Santa Fe reduces the sensitivity of all loudspeakers, I calculate sensitivity by comparing the measured, B-weighted level at 50" for a given voltage input, using a noise signal, with that obtained for a sample Rogers LS3/5A that I've measured both in Santa Fe and at sea level.
Footnote 2: Other than impedance, all acoustic measurements were made with the DRA Labs MLSSA system and a calibrated B&K 4006 microphone. To minimize reflections from the test setup, the measuring microphone is flush-mounted inside the end of a long tube. Reflections of the speaker's sound from the mike stand and its hardware will be sufficiently delayed not to affect the measurement.
Footnote 3: For my in-room spectral analyses I average six measurements at each of 10 separate microphone positions for left and right speakers individually, giving a total of 120 original spectra. These are then averaged to give a curve that, in my room, has proved to give a good correlation with a loudspeaker's perceived balance. I use an Audio Control Industrial SA-3050A spectrum analyzer with its own microphone, which acts as a check on the MLSSA measurements made with the B&K mike. I also used the Goldline DSP-30 automated spectrum analyzer.
|
| ||||||||||
- Log in or register to post comments


| Loudspeakers Amplification Digital Sources | Analog Sources Accessories Featured | Music Columns Retired Columns | Show Reports | Features Latest News Community | Resources Subscriptions |
 © 2024 Stereophile
AVTech Media Americas Inc., USA
All rights reserved

