| Columns Retired Columns & Blogs |
Plateau Camber 3.5 loudspeaker Measurements
Sidebar 4: 1990 Measurements
Playing the LEDR recording from the Chesky jazz sampler and test CD, I thought the 3.5ti did moderately well in the "Up" test. The image moved slightly above the loudspeaker and stopped without achieving the height sometimes heard. The "Over" was a little better, with the image leaving the left loudspeaker and traveling toward the right. The "Lateral" test, the easiest for a loudspeaker to reproduce, was good, the test signal producing a continuous image between the loudspeakers. I next drove the 3.5ti with a sinewave oscillator while feeling and listening to the enclosure. The 3.5ti was quite inert. Though many very small modes were apparent through the 100Hz–700Hz region, no serious cabinet resonances were detected. In addition, the very-low-amplitude modes I felt tended to be high in frequency (ca 500Hz) rather than below 300Hz, as is typical.
Looking next at the Camber 3.5ti's impedance magnitude and phase angle (fig.1), we can see that the impedance is above 6 ohms across nearly the entire band. The 3.5ti should thus present an easy load to the amplifier. The two impedance peaks in the bass indicate the reflex woofer loading. The impulse response (fig.2) shows a very clean initial impulse, but with some ultrasonic tweeter ringing. Like the Cyrus 782, the use of a second-order slope can be seen as a slight hump in the impulse response during the tweeter-ringing portion. The step response (fig.3) indicates that both drive-unuts are conected with positive acoustic polarity.
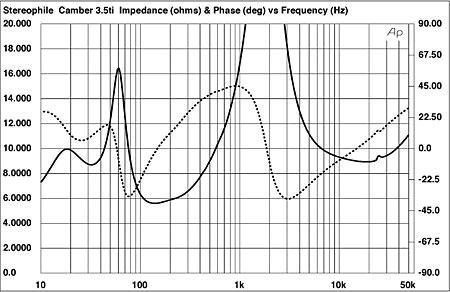
Fig.1 Camber 3.5ti, electrical impedance and phase (2 ohms/vertical div.).
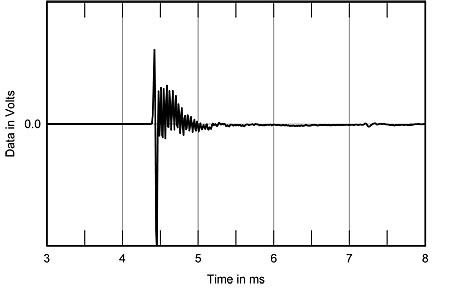
Fig.2 Camber 3.5ti, impulse response on tweeter axis at 50" (5ms time window, 30kHz bandwidth).
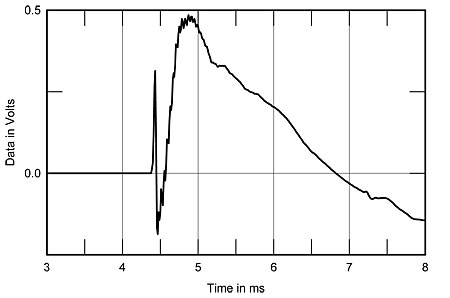
Fig.3 Camber 3.5ti, step response on tweeter axis at 50" (5ms time window, 30kHz bandwidth).
Moving to the frequency domain, fig.4 shows the 3.5ti's FFT-derived frequency response measured across a 30° lateral window. The nearfield woofer response, measured separately, has been added to the left portion of the graph. The plot reveals less high-frequency rise than I would have expected from the auditioning. The midband is quite flat, but with an overall rise in energy above 6kHz. The metal-dome tweeter resonance, indicated by the ringing seen in the impulse response, is visible at about 25kHz. The contribution of the 3.5ti's port can be seen in the nearfield woofer response, augmenting the woofer output below its rolloff.
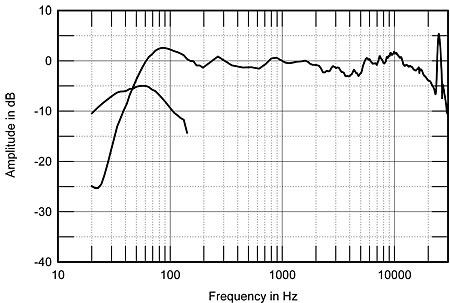
Fig.4 Camber 3.5ti, anechoic response on tweeter axis at 50", averaged across 30° horizontal window and corrected for microphone response, with nearfield responses of woofer.
Finally, the 3.5ti's waterfall plot is shown in fig.5. This is excellent performance and not surprising in light of the fact that the 3.5ti was designed with MLSSA; any resonant anomalies have been corrected. The decay is rapid and smooth, with just a faint touch of hash in the treble. Overall, the 3.5ti's waterfall plot is excellent.—Robert Harley
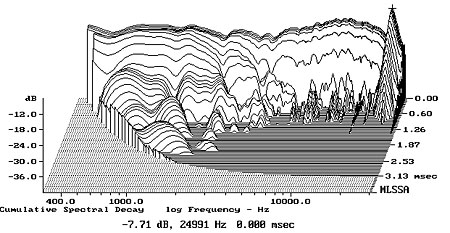
Fig.5 Camber 3.5ti, cumulative spectral-decay plot on tweeter axis at 50" (0.15ms risetime).
NEXT: Specifications »
|
| |||||||||
- Log in or register to post comments


| Loudspeakers Amplification Digital Sources | Analog Sources Accessories Featured | Music Columns Retired Columns | Show Reports | Features Latest News Community | Resources Subscriptions |
 © 2024 Stereophile
AVTech Media Americas Inc., USA
All rights reserved

