| Columns Retired Columns & Blogs |
Paradigm Reference Studio/100 v.3 loudspeaker Measurements
Sidebar 2: Measurements
The Studio/100 v.3's voltage sensitivity is above average, at an estimated 88.5dB/2.83V/m, which is within the margin of error of the earlier v.2's measured sensitivity of 89.5dB. The speaker's impedance plot (fig.1) reveals it still to be quite a demanding load, however, with a magnitude that drops to 2.5 ohms at 104Hz. The enclosure was well-braced and damped. The only resonant mode I could find on its panels lay at quite a high frequency of 426Hz. This was well down in level except on the back panel (fig.2), where its effect on sound quality will be reduced.
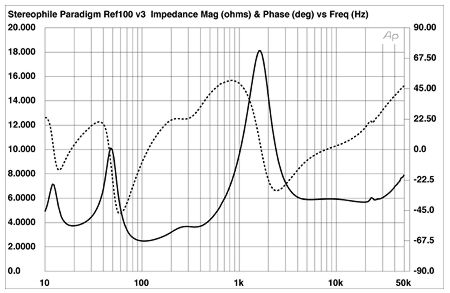
Fig.1 Paradigm Reference Studio/100 v.3, electrical impedance (solid) and phase (dashed). (2 ohms/vertical div.)
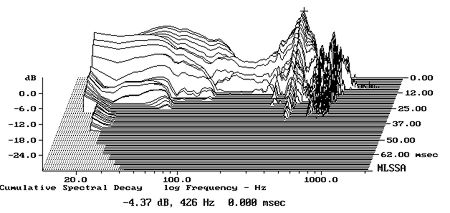
Fig.2 Paradigm Reference Studio/100 v.3, cumulative spectral-decay plot of accelerometer output fastened to center of back panel. (MLS driving voltage to speaker, 7.55V; measurement bandwidth, 2kHz.)
The saddle around 20Hz in the impedance magnitude trace implies a low tuning frequency for the 3"-diameter port on the front panel, under the woofers. This was confirmed by the nearfield measurement of the woofers' and port's outputs (fig.3, blue and green traces, respectively). The woofers' minimum-motion point actually lies just below 20Hz, though the port output covers a broader-than-expected bandpass, extending up through the midbass. I plotted the outputs in this graph in the ratio of the square roots of the radiating areas, which results in the woofer output appearing a little boosted in the upper bass compared with the midrange unit (fig.3, red trace), which rolls off at 18dB/octave below 200Hz.
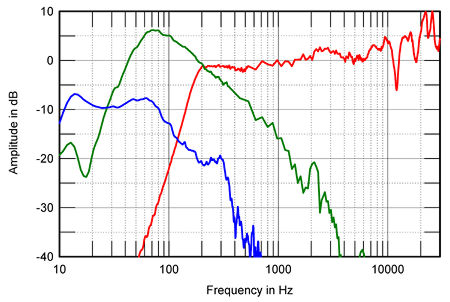
Fig.3 Paradigm Reference Studio/100 v.3, acoustic crossover on tweeter axis at 50", corrected for microphone response, with the nearfield midrange (red), woofer (green), and port (blue) responses plotted below 500Hz, 350Hz, and 1kHz, respectively.
The speaker's upper-frequency response is very flat on-axis in the midrange and low-middle treble, as is the overall output averaged across a 30-degree horizontal window on the tweeter axis (fig.4, red trace). The Studio/100's upper-bass output is still a little boosted in this graph, but this will subjectively balance the slightly elevated top octave. For reference, I plotted the response of the '100 v.2 in blue in fig.4; despite their different drive-unit lineups and enclosures, the two speakers are very similar, suggesting a consistent engineering vision at Paradigm.
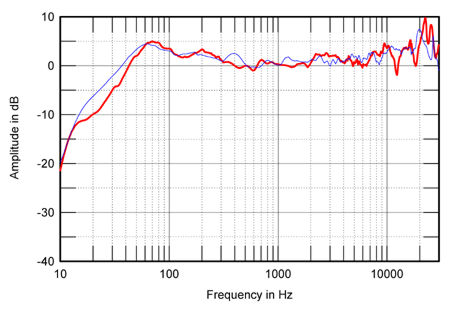
Fig.4 Paradigm Reference Studio/100 v.3, anechoic response on tweeter axis at 50", averaged across 30 degrees horizontal window and corrected for microphone response, with the complex sum of the nearfield midrange, woofer, and port responses, taking into account acoustic phase and distance from the nominal farfield point, plotted below 300Hz (red). Anechoic response of Studio/100 v.2, taken under identical conditions (blue).
The v.2 Studio/100 had rather an uneven horizontal radiation pattern (see the June 2000 issue, p.67, fig.6), but the v.3 was better behaved in this respect (fig.5). Its dispersion was even and uniform, with the on-axis dip at 12kHz filling in to the speaker's sides. The speaker was also uncritical regarding vertical listening axis (fig.6).
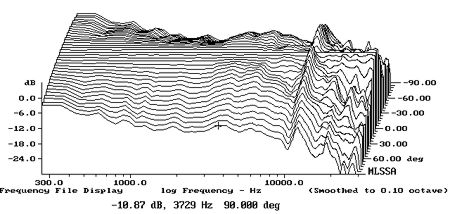
Fig.5 Paradigm Reference Studio/100 v.3, lateral response family at 50", normalized to response on tweeter axis, from back to front: differences in response 90 degrees-5 degrees off-axis, reference response, differences in response 5 degrees-90 degrees off-axis.
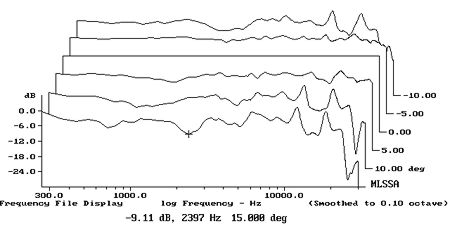
Fig.6 Paradigm Reference Studio/100 v.3, vertical response family at 50", from back to front: differences in response 10 degrees-5 degrees above HF axis, reference response, differences in response 5 degrees-15 degrees below HF axis.
Fig.7, produced by averaging 120 1/3-octave spectra taken for each speaker individually in a grid centered on the position of my ears, shows how this all came together in my listening room. The upper bass is still boosted a little, as are the mid- and high-treble regions. Alternatively, if the ear takes these regions as their reference, the midrange and low treble could be perceived as being slightly recessed, which is more the balance I heard in my auditioning. The low port-tuning frequency results in useful output down to the bottom of the audioband.

Fig.7 Paradigm Reference Studio/100 v.3, spatially averaged, 1/3-octave response in JA's listening room.
In the time domain, the Studio/100's step response (fig.8) indicates that the tweeter and midrange are connected in inverted acoustic polarity, the woofers in positive polarity. When you take into account the phase shift due to the crossover filters and the physical displacement of the diaphragms, this results in the excellent drive-unit integration seen in the frequency domain. The waterfall plot (fig.9) is much better than that of the earlier versions of the '100, with a clean decay free of resonance and reflection through the mid- and treble regions of the audible range.—John Atkinson
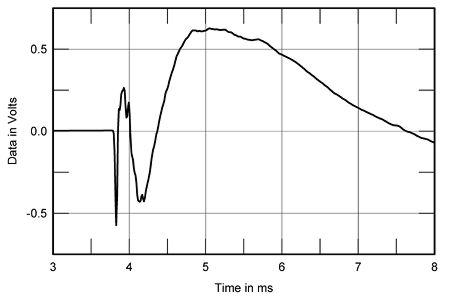
Fig.8 Paradigm Reference Studio/100 v.3, step response on tweeter axis at 50" (5ms time window, 30kHz bandwidth).
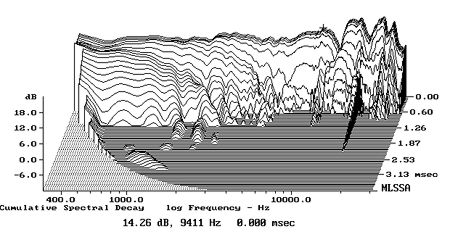
Fig.9 Paradigm Reference Studio/100 v.3, cumulative spectral-decay plot at 50" (0.15ms risetime).
|
|
| ||||||||||
- Log in or register to post comments


| Loudspeakers Amplification Digital Sources | Analog Sources Accessories Featured | Music Columns Retired Columns | Show Reports | Features Latest News Community | Resources Subscriptions |
 © 2024 Stereophile
AVTech Media Americas Inc., USA
All rights reserved

