| Columns Retired Columns & Blogs |
NAD C 328 integrated amplifier Measurements
Sidebar 3: Measurements
I measured the NAD C 328 using my Audio Precision SYS2722 system (see the January 2008 "As We See It"). Because class-D amplifiers emit relatively high levels of ultrasonic noise that would drive my analyzer's input into slew-rate limiting, all measurements were taken with Audio Precision's auxiliary AUX-0025 passive low-pass filter, which eliminates noise above 200kHz.
Looking first at the line-level analog inputs: With the NAD's volume control set to "0.0dB," the maximum voltage gain at 1kHz into 8 ohms measured 25.6dB from the speaker terminals and 1.2dB from the headphone terminals. Increasing the volume setting to "+12dB" increased the gain by exactly 12dB from both sets of outputs. The line inputs preserved absolute polarity (ie, were non-inverting), and the input impedance was 15k ohms at low and middle frequencies, dropping slightly to 14.4k ohms at 20kHz.
The headphone output impedance was a low 11.6 ohms at all audio frequencies, and the response was flat to 200kHz. The output impedance at the speaker terminals was 0.1 ohm at 20Hz and 1kHz, rising very slightly to 0.12 ohm at 20kHz. The output is flat into resistive loads (fig.1, blue, red, and green traces), rolling off above the audioband to reach –3dB at 45kHz, and any modulation of the frequency response with our standard simulated loudspeaker was within ±0.05dB (gray trace). The yellow and magenta traces in this graph show the response with Bass EQ activated. The low frequencies peak by just over 6dB at 80Hz, then roll off rapidly.
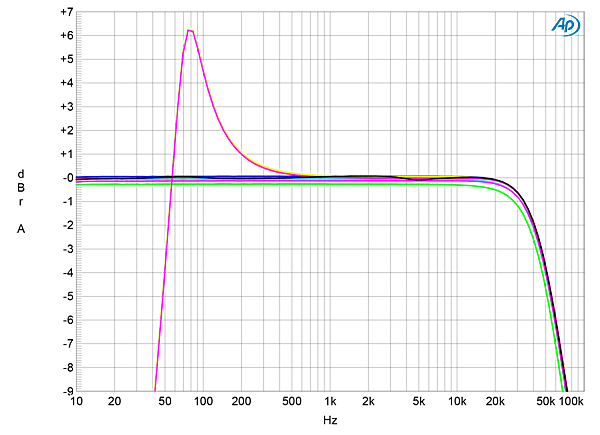
Fig.1 NAD C 328, analog input, frequency response at 2.83V into: simulated loudspeaker load (gray), 8 ohms (left channel blue, right red), 4 ohms (left cyan, right magenta), 2 ohms (green), 8 ohms with Bass EQ engaged (left yellow, right magenta) (1dB/vertical div.).
The C 328's reproduction of a 10kHz squarewave (fig.2) reveals a slight, critically damped overshoot, with no ringing apparent. Channel separation was excellent, at 90dB in both directions between 800Hz and 2kHz, though this decreased at the frequency extremes, to 78dB at 20Hz and 63dB at 20kHz. Without the AP low-pass filter and with no signal present, about 212mV of ultrasonic noise was present at the speaker outputs. With the filter, the analog inputs shorted to ground, and the volume control set to "0.0dB," the wideband, unweighted signal/noise ratio (ref. 2.83V into 8 ohms) measured a superb 84.3dB. Restricting the measurement bandwidth to 22kHz increased the ratio to 92.75dB, and an A-weighting filter increased it further, to 95dB. (All ratios are the average of the two channels.) Levels of any residual spuriae at the AC power-line frequency and its harmonics were extremely low (fig.3), but spurious tones were present at 280 and 720Hz. Although these are very low in level, I was surprised to see them.
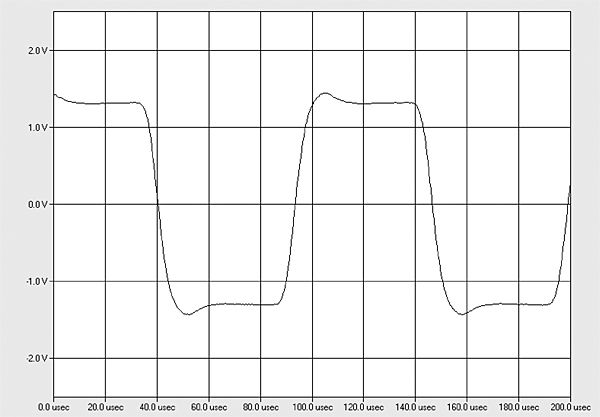
Fig.2 NAD C 328, analog input, small-signal, 10kHz squarewave into 8 ohms.
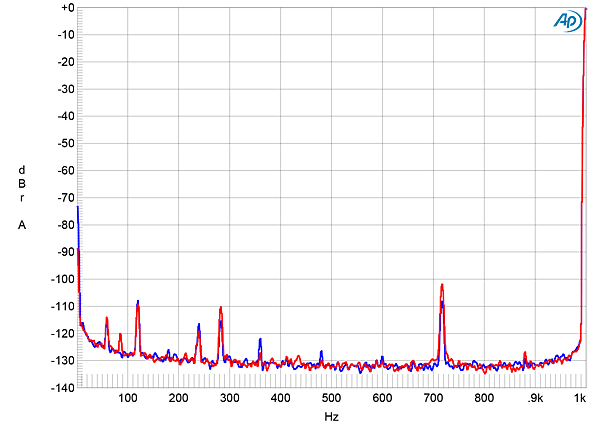
Fig.3 NAD C 328, analog input, spectrum of 1kHz sinewave, DC–1kHz, at 1W into 8 ohms (left channel blue, right red; linear frequency scale).
The C 328 is specified as delivering a maximum continuous output power of 40Wpc into 8 ohms (16dBW) or 4 ohms (13dBW). At our usual definition of clipping (ie, when the percentage of THD+noise in the amplifier's output reaches 1%), with continuous drive in both channels the C 328 exceeded its specification, delivering 50Wpc into 8 ohms (fig.4, 17dBW) and 56Wpc into 4 ohms (fig.5, 14.5dBW). Distortion levels at moderate powers were very low, and were consistent with both frequency and load impedance (fig.6). Although the shape of the spuriae waveform at 15Wpc into 8 ohms (fig.7, red trace) is obscured by high-frequency noise, the distortion signature appears to be primarily second-harmonic in nature (fig.8). Though higher-order harmonics are visible in this graph, they all lie at or below –100dB (0.001%). Intermodulation distortion at high powers was extremely low, even into 4 ohms (fig.9). There is some peculiar spectral content present around 5kHz, though this is still very low in level.
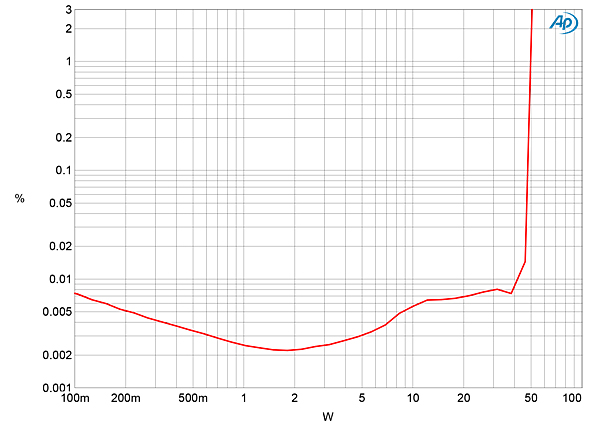
Fig.4 NAD C 328, analog input, distortion (%) vs 1kHz continuous output power into 8 ohms.
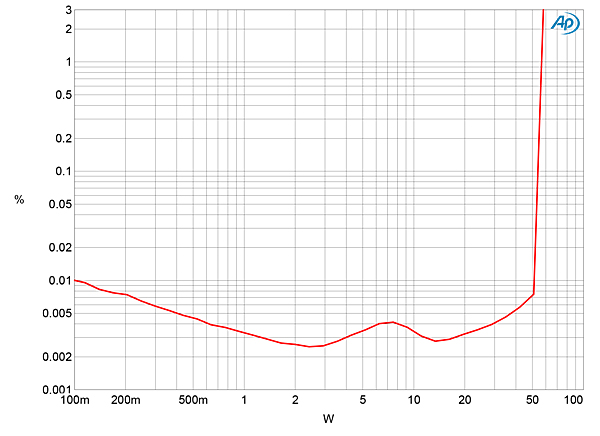
Fig.5 NAD C 328, analog input, distortion (%) vs 1kHz continuous output power into 4 ohms.
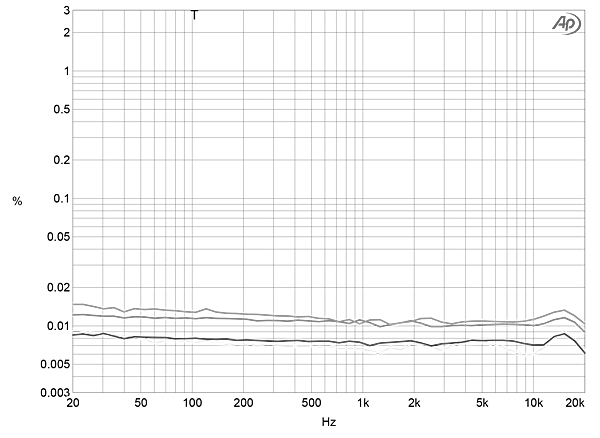
Fig.6 NAD C 328, analog input, distortion (%) vs frequency at 12.65V into: 8 ohms (left channel blue, right red), 4 ohms (left cyan, right magenta).
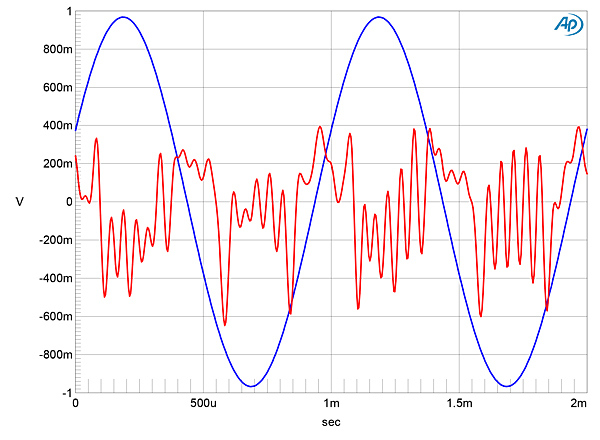
Fig.7 NAD C 328, analog input, 1kHz waveform at 15W into 8 ohms, 0.0066% THD+N (blue); distortion and noise waveform with fundamental notched out (red, not to scale).
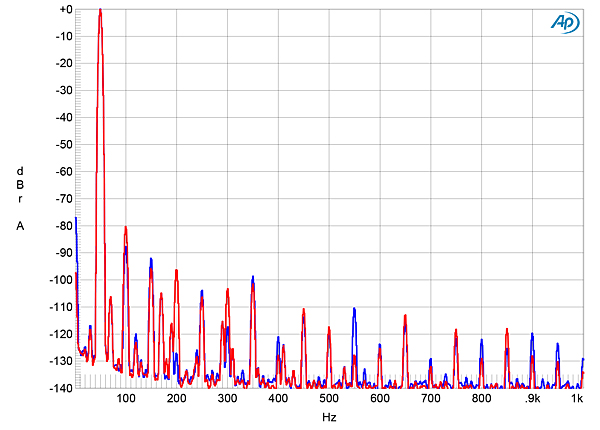
Fig.8 NAD C 328, analog input, spectrum of 50Hz sinewave, DC–1kHz, at 20Wpc into 4 ohms (left channel blue, right red; linear frequency scale).
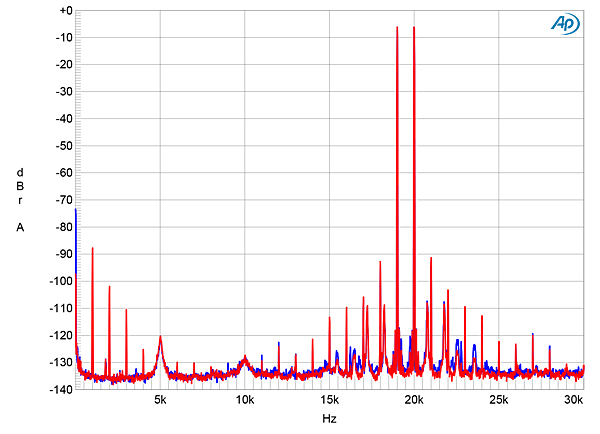
Fig.9 NAD C 328, analog input, HF intermodulation spectrum, DC–30kHz, 19+20kHz at 20Wpc peak into 4 ohms (left channel blue, right red; linear frequency scale).
The phono input preserves absolute polarity and offers a maximum gain of 62dB at the speaker outputs, which is appropriate for moving-magnet cartridges. The input impedance was also appropriate for MM cartridges, at 45k ohms at 20Hz and 1kHz, and 39.5k ohms at 20kHz. The RIAA error was both very low and well matched between channels (fig.10). The phono input's wideband signal/noise ratio, ref. 1kHz at 5mV, was excellent at 59.9dB, this improving to 73dB when A-weighted.
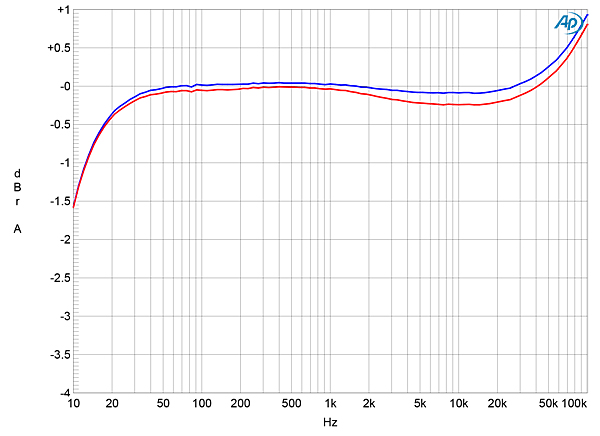
Fig.10 NAD C 328, phono input, response with RIAA correction (1dB/vertical div.).
The phono input's overload margins were also excellent, at >17dB across the audioband, and both harmonic distortion (fig.11) and intermodulation distortion (fig.12) were extremely low. However, some odd low-level spectral content was again apparent in the mid-treble region.
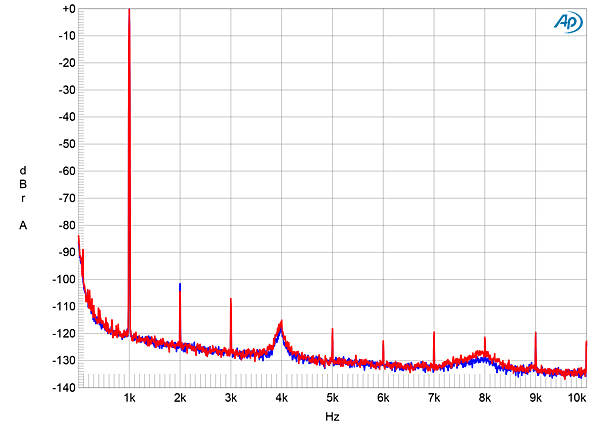
Fig.11 NAD C 328, phono input, spectrum of 50Hz sinewave, DC–1kHz, at 5mV input (left channel blue, right red; linear frequency scale).
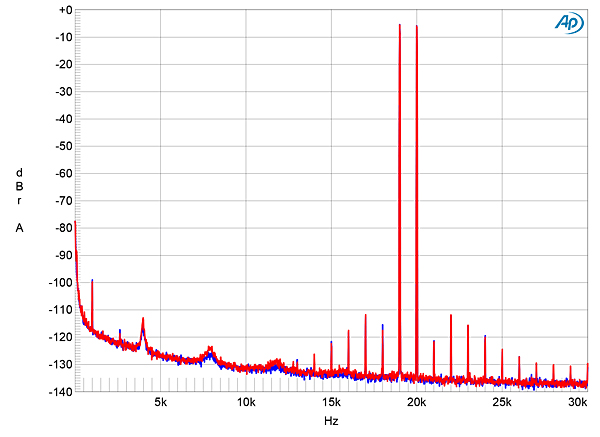
Fig.12 NAD C 328, phono input, HF intermodulation spectrum, DC–30kHz, 19+20kHz (left channel blue, right red; linear frequency scale).
The C 328's S/PDIF inputs preserved absolute polarity and locked to datastreams with all sample rates up to 192kHz. A 1kHz digital signal at –12dBFS resulted in an output level of 10V into 8 ohms with the volume control set to "0.0," which suggests that the digital inputs have 6dB too much gain; ie, a digital signal at –6dB will just drive the amplifier into clipping into 8 ohms. This extra gain may well be useful with low-sensitivity headphones, however.
The NAD's impulse response with 44.1kHz data (fig.13) indicates that the reconstruction filter is a conventional linear-phase type, with time-symmetrical ringing to either side of the single sample at 0dBFS. With 44.1kHz-sampled white noise (fig.14, red and magenta traces), the C 328's response rolled off sharply above 20kHz, but didn't reach full stop-band suppression until above the Nyquist frequency of 22.05kHz. An aliased image at 25kHz of a full-scale tone at 19.1kHz (blue and cyan traces) can therefore be seen, though this lies at –90dB (0.003%). However, the noise floor rises a little in the top audio octave and above. The distortion harmonics of the 19.1kHz tone are visible above the ultrasonic noise floor, the third harmonic being the highest in level at –74dB (0.02%).
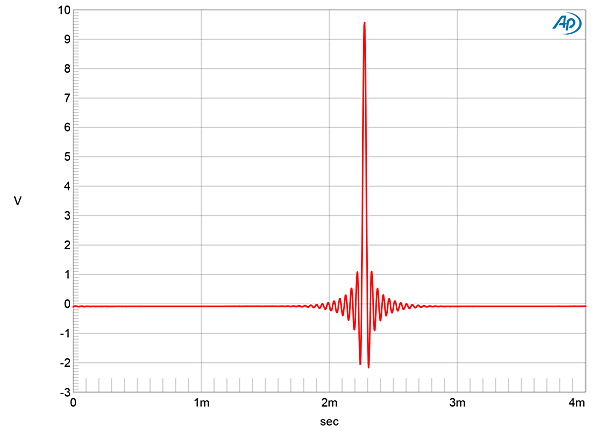
Fig.13 NAD C 328, digital input, impulse response (one sample at 0dBFS, 44.1kHz sampling, 4ms time window).
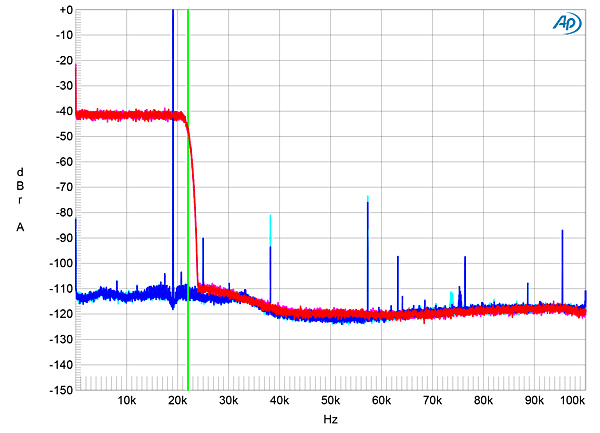
Fig.14 NAD C 328, digital input, wideband spectrum of white noise at –4dBFS (left channel red, right magenta) and 19.1kHz tone at 0dBFS (left blue, right cyan), with data sampled at 44.1kHz (20dB/vertical div.).
When I examined the C 328's digital frequency response with S/PDIF data at 44.1, 96, and 192kHz, the response followed the same basic shape, with a sharp rolloff just below the two lower sample rates (fig.15). When I increased the bit depth from 16 to 24 with a dithered 1kHz tone at –90dBFS (fig.16), the noise floor dropped by almost 20dB, meaning that the C 328 offers more than 19 bits' worth of resolution, which is excellent. However, a slight modulation of the noise floor can be seen in the mid-treble with 24-bit data (blue and red traces). With undithered data representing a tone at exactly –90.31dBFS (fig.17), the three DC voltage levels described by the data were well resolved and the waveform was perfectly symmetrical. With undithered 24-bit data, the result was a clean sinewave (fig.18).
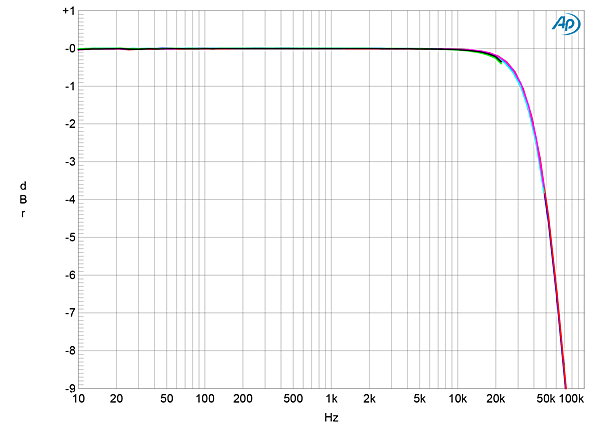
Fig.15 NAD C 328, digital input, frequency response at –12dBFS into 100k ohms with data sampled at: 44.1kHz (left channel green, right gray), 96kHz (left cyan, right magenta), 192kHz (left blue, right red) (1dB/vertical div.).
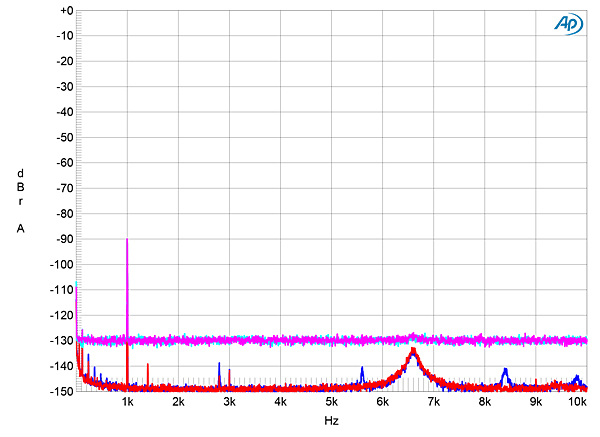
Fig.16 NAD C 328, digital input, spectrum with noise and spuriae of dithered 1kHz tone at –90dBFS with: 16-bit data (left channel cyan, right magenta), 24-bit data (left blue, right red) (20dB/vertical div.).
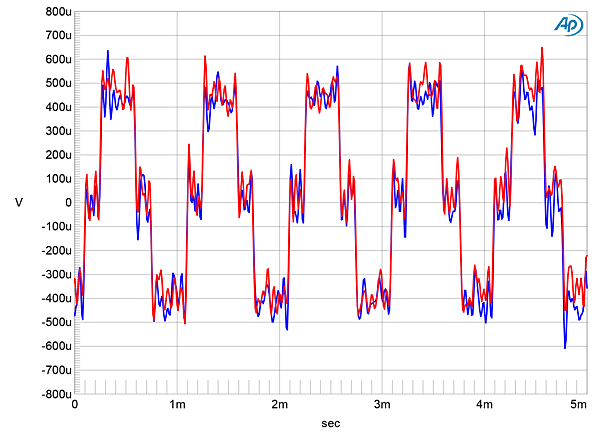
Fig.17 NAD C 328, digital input, waveform of undithered 1kHz sinewave at –90.31dBFS, 16-bit S/PDIF data (left channel blue, right red).
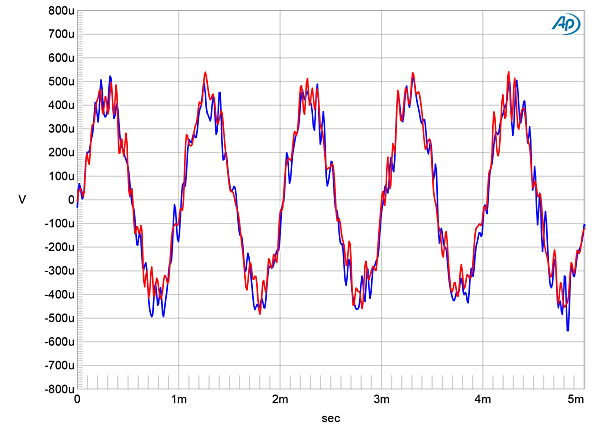
Fig.18 NAD C 328, digital input, waveform of undithered 1kHz sinewave at –90.31dBFS, 24-bit S/PDIF data (left channel blue, right red).
The NAD offered relatively low levels of intermodulation distortion via its digital inputs (fig.19), though the noise floor to either side of the high-level tones at 19 and 20kHz had a scalloped appearance. This same scalloped noise floor made an appearance when I tested the C 328's rejection of word-clock jitter with 16-bit TosLink J-Test data (fig.20). It obscures the odd-order harmonics of the LSB-level, low-frequency squarewave, and low-level sidebands can be seen at power-supply–related frequencies, as well as a higher-level pair of sidebands of unknown origin at ±1.7kHz.
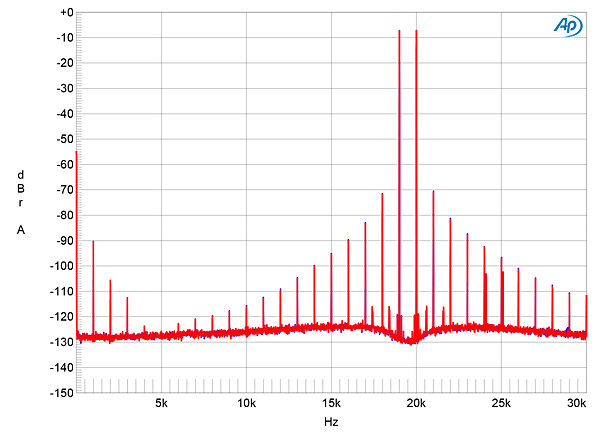
Fig.19 NAD C 328, digital input, HF intermodulation spectrum, DC–30kHz, 19+20kHz at 0dBFS, 44.1kHz data (left channel blue, right red; linear frequency scale).
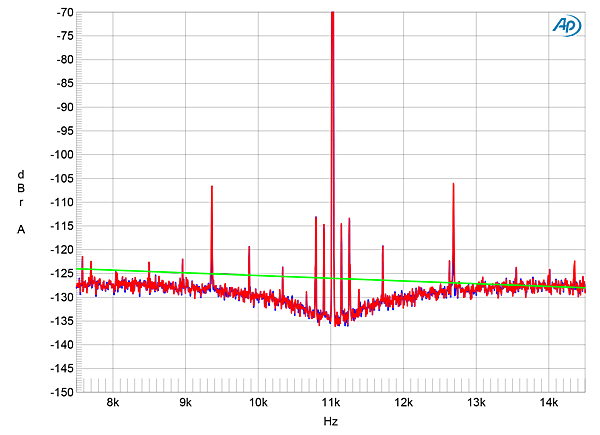
Fig.20 NAD C 328, digital input, high-resolution jitter spectrum of analog output signal, 11.025kHz at –6dBFS, sampled at 44.1kHz with LSB toggled at 229Hz: 16-bit TosLink data (left channel blue, right red). Center frequency of trace, 11.025kHz; frequency range, ±3.5kHz.
Overall, however, NAD's C 328 offers a lot of good measured performance in an inexpensive package.—John Atkinson
|
| ||||||||||
- Log in or register to post comments


| Loudspeakers Amplification Digital Sources | Analog Sources Accessories Featured | Music Columns Retired Columns | Show Reports | Features Latest News Community | Resources Subscriptions |
 © 2024 Stereophile
AVTech Media Americas Inc., USA
All rights reserved

