Meitner MA3 Integrated D/A processor Measurements

Sidebar 3: Measurements

I measured the Meitner MA3 with my Audio Precision SYS2722 system, repeating some tests with the magazine's higher-resolution APx500 system. I performed the testing using the AES3 and coaxial and TosLink S/PDIF inputs, all of which accepted data sampled at all rates up to 192kHz, as well as via the USB and network ports, the former using my MacBook Pro, the latter using Roon. Apple's AudioMIDI utility revealed that the MA3's USB port accepted 16- and 24-bit integer data sampled at all rates from 44.1kHz to 384kHz. Apple's USB Prober app identified the Meitner as "MA-3 DAC with MQA Decoder" from "EMM Labs" and confirmed that the USB port operated in the optimal isochronous asynchronous mode.

The Meitner's analog outputs preserved absolute polarity (ie, were noninverting) via all of the MA3's digital inputs. The volume control operates in accurate 0.5dB steps and with the control set to its maximum, the output level with full-scale 1kHz data was 2.07V from the single-ended outputs and 4.16V from the balanced outputs. The balanced and unbalanced output impedances were identical, at a low 298 ohms from 20Hz to 20kHz.

The MA3's impulse response with 44.1kHz PCM data (fig.1) indicates that the reconstruction filter offers almost perfect time-domain behavior, with a single cycle of ringing on both sides of the single full-scale sample. With white noise sampled at 44.1kHz, the filter rolled off slowly above the audioband (fig.2, magenta and red traces), not reaching full stop-band attenuation until 44.1kHz. Nevertheless, the aliased image at 25kHz of a full-scale tone at 19.1kHz (cyan, blue) was suppressed by almost 120dB (see later). This spectrum was taken with 44.1kHz USB data rather than TosLink, as I needed to set the SYS2722 A/D converter's sample rate to its maximum of 200kHz. Repeating the test with 44.1kHz TosLink data sourced from a CD player gave the same result, however (fig.3). Fig.2 also indicates that the harmonics associated with the 19.1kHz tone are all very low in level.

622MA3fig01

Fig.1 Meitner MA3, impulse response (one sample at 0dBFS, 44.1kHz sampling, 4ms time window).

622MA3fig02

Fig.2 Meitner MA3, wideband spectrum of white noise at –4dBFS (left channel red, right magenta) and 19.1kHz tone at 0dBFS (left blue, right cyan) into 100k ohms with USB data sampled at 44.1kHz (20dB/vertical div.).

622MA3fig03

Fig.3 Meitner MA3, spectrum of 19.1kHz tone at 0dBFS into 100k ohms with 44.1kHz TosLink data sourced from a CD player (left blue, right red; 20dB/vertical div.)

Fig.4 shows the Meitner's frequency response with TosLink data sampled at 44.1, 96, and 192kHz. The responses with the two lower sample rates are flat in the audioband. However, and very peculiarly, the response with 192kHz data (blue and red traces) rolls off earlier than with data sampled at 96kHz (cyan, magenta). This graph was taken with the SYS2722 from the MA3's balanced outputs and its volume control set to its maximum. I repeated the test from the unbalanced outputs and at lower volume-control settings, as well as with USB and network data and with the APx500—the results were identical.

622MA3fig04

Fig.4 Meitner MA3, frequency response at –12dBFS into 100k ohms with TosLink data sampled at: 44.1kHz (left channel green, right gray), 96kHz (left cyan, right magenta), and 192kHz (left blue, right red) (1dB/vertical div.).

Channel separation (not shown) was superb, at >120dB in both directions below 3kHz. It decreased to a still excellent 112dB at the top of the audioband. The low-frequency noisefloor (fig.5) was free from any power supply–related spuriae. This graph was taken with TosLink data; the spectra with USB and network data were identical.

622MA3fig05

Fig.5 Meitner MA3, balanced output, spectrum with noise and spuriae of dithered 1kHz tone at 0dBFS with 24-bit TosLink data (left blue, right red) (20dB/vertical div.).

The red trace in fig.6 plots the error in the analog output level as a 24-bit, 1kHz digital tone drops from 0dBFS to –140dBFS. The amplitude error is negligible until the signal lies below –120dBFS, which implies high resolution. An increase in bit depth from 16 to 24 with dithered data representing a 1kHz tone at –90dBFS (fig.7) dropped the MA3's noisefloor by 20dB, which suggests that the resolution is between 19 and 20 bits. When I played undithered data representing a tone at exactly –90.31dBFS, the waveform was symmetrical and the three DC voltage levels were well-resolved (fig.8). Repeating the measurement with undithered 24-bit data gave a well-formed sinewave (fig.9).

622MA3fig06

Fig.6 Meitner MA3, left channel, 1kHz output level vs 24-bit data level in dBFS (blue, 20dB/vertical div.); linearity error (red, 1dB/small vertical div.).

622MA3fig07

Fig.7 Meitner MA3, spectrum with noise and spuriae of dithered 1kHz tone at –90dBFS with: 16-bit TosLink data (left channel cyan, right magenta), 24-bit TosLink data (left blue, right red) (20dB/vertical div.).

622MA3fig08

Fig.8 Meitner MA3, waveform of undithered 1kHz sinewave at –90.31dBFS, 16-bit data (left channel blue, right red).

622MA3fig09

Fig.9 Meitner MA3, waveform of undithered 1kHz sinewave at –90.31dBFS, 24-bit data (left channel blue, right red).

The MA3 produced very low levels of harmonic distortion. With a full-scale 50Hz tone, the third harmonic was the highest in level in the balanced outputs at just –106dB (0.0005%, fig.10). This spectrum was taken into the high 100k ohms load. Commendably, when I reduced the load impedance to 600 ohms, the levels of the harmonic didn't change. The distortion was even lower at higher frequencies. With a 1kHz tone at 0dBFS, the harmonics in the balanced output were too low for the SYS2722 to resolve. Measured with the APx500, the second and third harmonics each lay at just –126dB (0.00005%, fig.11). Intermodulation distortion with an equal mix of 19 and 20kHz tones, each lying at –6dBFS and sampled at 44.1kHz, was very low in level (fig.12). The aliased images of the primary tones in the audioband lie close to –100dB. Above the audioband, however, the aliased images at 24.1kHz and 25.1kHz are almost as high in level as the primary tones—not what I was expecting from the spectrum of the 19.1kHz tone in fig.2 (footnote 1).

622MA3fig10

Fig.10 Meitner MA3, balanced output, 24-bit TosLink data, spectrum of 50Hz sinewave, DC–1kHz, at 0dBFS into 100k ohms (left channel blue, right red; linear frequency scale).

622MA3fig11

Fig.11 Meitner MA3, balanced output, 24-bit TosLink data, spectrum of 1kHz sinewave, DC–10kHz, at 0dBFS into 100k ohms (left channel blue, right red; linear frequency scale).

622MA3fig12

Fig.12 Meitner MA3, balanced output, 24-bit TosLink data, HF intermodulation spectrum, DC–30kHz, 19+20kHz at 0dBFS into 100k ohms, 44.1kHz data (left channel blue, right red; linear frequency scale).

Fig.13 shows the spectrum of the MA3's output when it was fed high-level, optical 16-bit J-Test data. The odd-order harmonics of the undithered low-frequency, LSB-level squarewave lie at the correct levels, indicated by the sloping green line. Repeating the analysis with 24-bit J-Test data resulted in a clean spectrum (fig.14). The 24-bit jitter spectra were identical with TosLink, AES3, USB, and network data.

622MA3fig13

Fig.13 Meitner MA3, high-resolution jitter spectrum of analog output signal, 11.025kHz at –6dBFS, sampled at 44.1kHz with LSB toggled at 229Hz: 16-bit TosLink data (left channel blue, right red). Center frequency of trace, 11.025kHz; frequency range, ±3.5kHz.

622MA3fig14

Fig.14 Meitner MA3, high-resolution jitter spectrum of analog output signal, 11.025kHz at –6dBFS, sampled at 44.1kHz with LSB toggled at 229Hz: 24-bit TosLink data (left channel blue, right red). Center frequency of trace, 11.025kHz; frequency range, ±3.5kHz.

Overall, Meitner's MA3 did very well on the test bench, though I remain puzzled by the premature ultrasonic rolloff with PCM data sampled at 192kHz and the inconsistency of the aliased image levels in figs.2 and 10 (footnote 2).—John Atkinson


Footnote 1: The same peculiarity was seen in JA's measurements of the EMM Labs DV2: The aliased image of a single 19.1kHz tone was attenuated by more than 100dB, but there was little attenuation of ultrasonics in the intermodulation spectrum, and a 44.1kHz white noise spectrum rolls off very slowly. See fig.2.—Jim Austin

Footnote 2: After this review had been published, I am embarrassed to admit that I had forgotten about the use of different filters depending on the audio signal that Ed Meitner introduced in his 1993 IDAT. From page 2 of that review: "In the IDAT, a detector looks at the nature of the audio signal and directs the digital audio data to the filter best suited for that type of signal. Musical components that are fairly continuous in level with no transients are routed to the FIR filter; signals with steep leading edges are sent to the IIR filter. The two filters' outputs are then combined and output to the DACs. The musical signal is thus processed by the optimum filter type for that kind of signal."—John Atkinson

COMPANY INFO
Meitner Audio
119–5065 13th St. S.E.
Calgary, Alberta
Canada T2G5M8
(403) 225-4161
ARTICLE CONTENTS

COMMENTS
Archimago's picture

Interesting results John and thanks for Footnote 2.

Curious if over the years you have an idea of how this IDAT filter routing works in the modern DACs. Given the age of the technology (since 1993), if it's similar in implementation, it likely isn't anything complex.

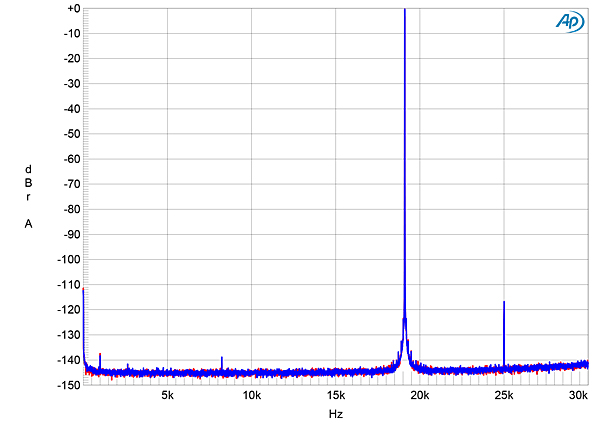
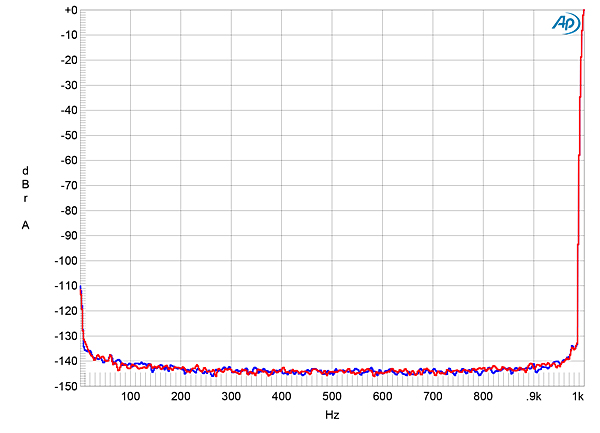
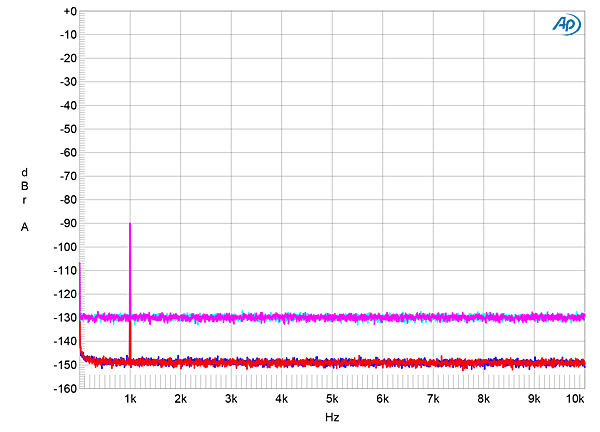
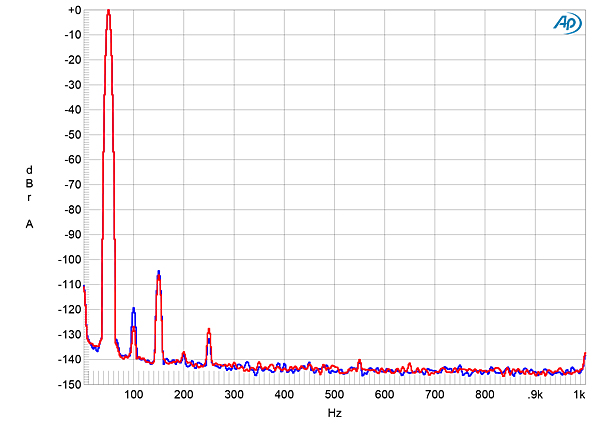
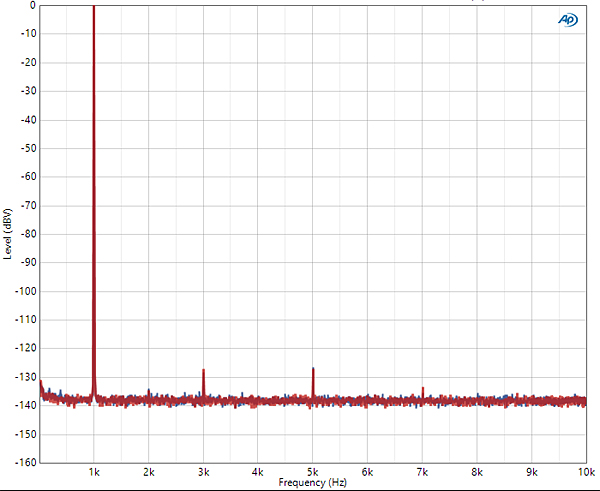
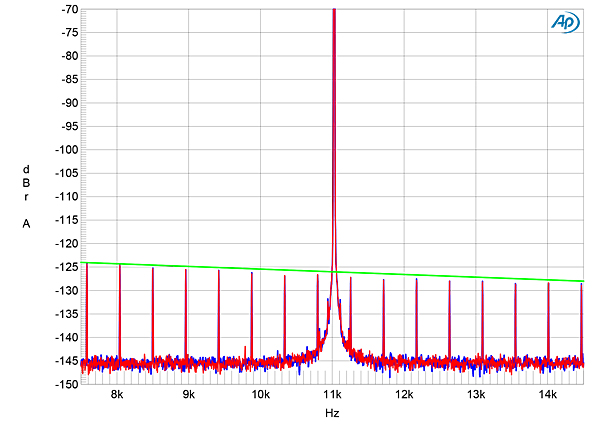
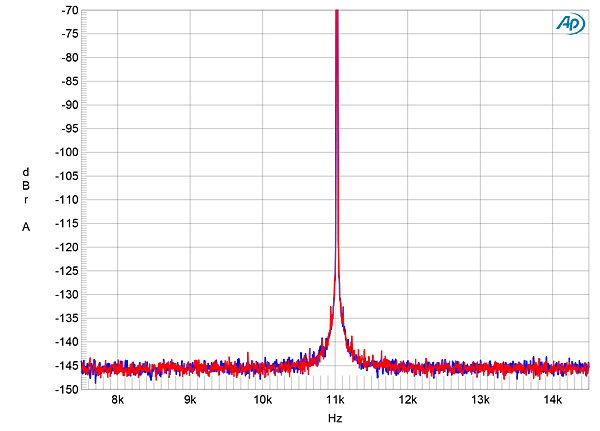
I wonder based on these measurements if all it is is a detection of when you're just sending the DAC a single sine tone like the 19kHz, 1kHz, and 50Hz 0dBFS measurements. It then implements a steep FIR in order to achieve that -120dB image suppression as shown in the 19kHz graph.

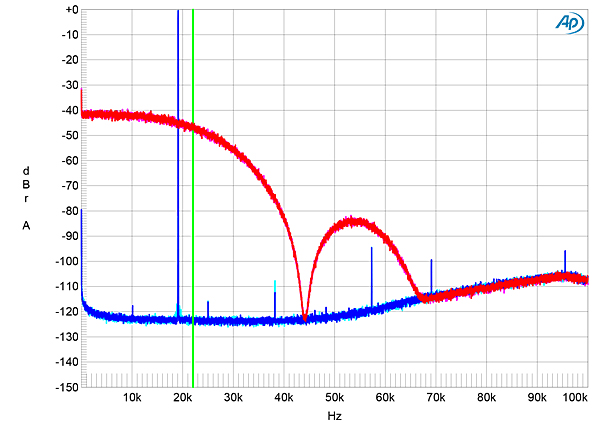
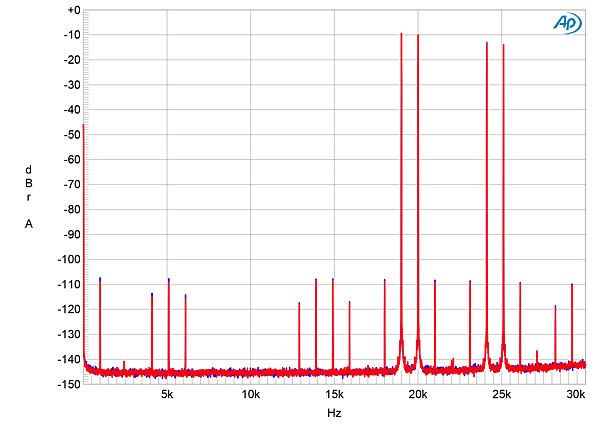
Anything else more complex like the 19+20kHz CCIF (Figure 12, which is still very much "continuous") will just be treated with what basically looks like a straight forward linear interpolation resampler.

Related to this is the question of the latency between switching filters. Most of the time it must be just using the linear interpolation. And on the occasional time when it detects a constant tone, it then switches to the steep FIR filter. I wonder how many cycles it takes to detect and switch!? Would be very interesting to know within a piece of music just how frequently this filter switching takes place (if even ever in real music!).

Soundguy123's picture

Good questions Archimago!

The fact that “complex” music (nothing complex about two test tones 1KHz apart) is processed with a very leaky filter is indeed concerning. Although the in band IMD isn’t at very worrying levels one can’t help but be concerned about such strong non-music related signals aliased ghost images passing through the D to A conversion stage.

The philosophy of IDAT seems odd - use of an IIR filter will add phase issues. As everyone should know, a linear phase FIR filter is the best and most accurate approach despite a small overall computational delay. A delay is only of concern in live music - so FIR filters dominate consumer playback. Today there are much easier mathematical ways to get round the brick wall filter in band issues (upsampling for example, can help push the filter further away from the in band signal producing excellent in band phase).

That said MQA deliberately messes up in band phase by adding group delay at higher frequencies and MQA claim this form of added distortion is somehow a more accurate conversion….

An intelligent discussion of simple first or second year university physics/engineering time series analysis is it seems no longer possible… even major audio chip designers like Sabre have implemented filter solutions that are intentionally distorting the conversion process….

Mathematical rigour seems to be in short supply these days…but no shortage of arm waving!

Of curiosity - could the rumoured interest by DJ’s in Meitners MA3 converter be simply related to live production - the DJ may prefer an IIR fast filter in order for adjustments to sound to be instant rather than appearing after a slight delay?

Indydan's picture

Would it be possible for JVS to write just one review in which he doesn't dry hump MQA? Geez....

Jason Victor Serinus's picture

for Jason to state his honest feelings about MQA without some people feeling the need to oppose his viewpoint?

ayang90's picture

Thanks for the review of the MA3. I am in the process of looking for a new Roon ready DAC and a quality MQA implementation is important to me. Definitely going to audition the Meitner MA3.

Lonestar166's picture

Thanks for the excellent review. Loved the footnotes about the Cadillac and the Rambler. I remember them both. My grandfather, a one-armed vet, had a green Rambler with a white roof.

X