| Columns Retired Columns & Blogs |
MartinLogan Sequel II loudspeaker Measurements
Sidebar 3: Measurements
Electrostatic loudspeakers have gained a reputation for being hard to drive, so it was with my bump of curiosity piqued that I measured the load represented by the Sequel II. Fig.1 shows the result. A well-damped peak at 33Hz reveals the woofer tuning, while the overall graph suggests a rating of 4 ohms rather than 6. The speaker drops to 3 ohms at 440Hz and to a hair over 2 at 24kHz, from which I infer that puny amplifiers, current-wise, should best be avoided. (Music has considerable energy at 440Hz, though only the occasional high-level cymbal crash will cause copious globs of HF current to be drawn from the amplifier.) MartinLogan claims a phase angle of 45° or less across the range; this graph confirms that to be the case, but the speaker's ability to shut down the Krell with prolonged pink-noise drive did worry me. (It should be noted that this was on one of the hottest days in June, however, with the outside air temperature in the high 90s.)
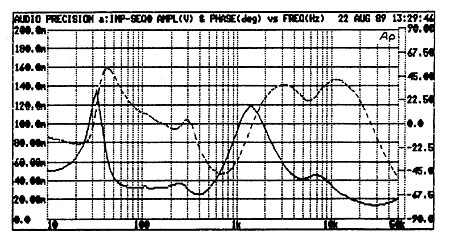
Fig.1 MartinLogan Sequel II, electrical impedance (solid) and phase (dashed). (2 ohms/vertical div.)
Fig.2 shows the Sequel's response to a 55µs rectangular pulse, taken over a 5ms time window with the microphone about halfway up the electrostatic panel (ie, about 45" off the floor). The sharp spike is well-defined, but the large overshoot and lazy decay—the bulk of the energy—takes some 2.5ms to arrive, typical of a design using a second-order or higher crossover. The response of the Quad ESL-63 electrostatic to an identical pulse with the same scaling can be found here note the relative lack of lower-frequency overhang in the tail. The impulse tail of the Sequel, like the Quad, reveals some complex delayed resonant behavior. This is hard to analyze, but a component with a period of 200µs can be discerned, as can ones with periods of just over 400µs and a fraction over 125µs. These are equivalent to frequencies of 4kHz, just under 2kHz, and approximately 7kHz, respectively.
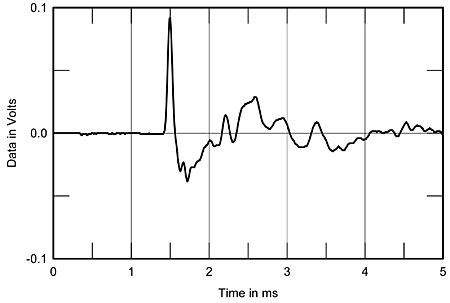
Fig.2 MartinLogan Sequel II, impulse response on tweeter axis at 50" (5ms time window, 50kHz bandwidth).
Repeating the impulse measurement on the same axis, but this time with the microphone some 5' away and over 10ms, and calculating the Discrete Fourier Transform (with the data windowed with a Hamming Function), gave the result shown in fig.3. This represents the anechoic response of the loudspeaker plotted with 100Hz resolution, and is shown from 200Hz to 10kHz. (The roll-off below 400Hz is due to the windowing of the data.) The speaker's output gently falls from 600Hz to 6kHz, due to the fact that the measuring microphone was not sufficently distant form the speaker to be in the farfield, always an issue with physically large radiators. Over this curve are superimposed sharp peaks and dips due both to resonances and to interference effects (though not to anything like the extent with the multiway Infinity IRS Beta; see June, p.159, fig.6). It is impossible to distinguish on this plot between the former, which may be audible, and the latter, which, being mic-position–dependent, will be innocuous, but peaks can be made out at 1660Hz, 4kHz, and 7kHz. The sharply defined dips at 1370Hz and 2440Hz are almost certainly due to interference.
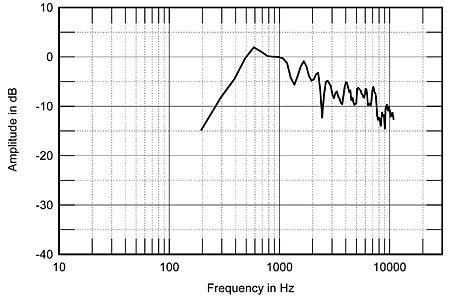
Fig.3 MartinLogan Sequel II, anechoic response on axis 45" from floor, midway up electrostatic panel.
That this response is very listening-axis–dependent is confirmed by looking at the Fourier Transform of the impulse response taken on the listening axis, which is shown in fig.4. With the lower microphone position, the notch at 1370Hz has moved down to 1075Hz, as well as becoming deeper, confirming that it is an interference phenomenon in the vertical plane. The pattern of peaks and dips in the treble is very similar to those in fig.3, though the treble level now does not droop as much. There is also more upper-bass energy evident.

Fig.4 MartinLogan Sequel II, anechoic response on listening axis.
It is often said that an electrostatic speaker will have an inherently good time-domain performance. Fig.2, however, suggests otherwise for the Sequel II, and to confirm this fact, I fed the speaker with a 500Hz squarewave. By carefully moving the microphone position, I ended up with the waveform shown in fig.5. This is actually not too bad compared with a typical two-way dynamic design using high-order crossover slopes, but the speaker is still not as time-coherent as the Quad ESL-63 or even the Vandersteen 2Ci (see June, p.154, fig.6, and May, p.102, fig.6, respectively). The opposite-going spike at the start of the negative-going plunge of the squarewave is a mystery to me; moving the measuring microphone more on-axis brought up the leading-edge spike to give more of a symmetrical waveform, but without sharpening up the "square" character. Fourier analysis confirms the fact that the distortion of the square shape is due to non–time-coherent behavior, though the 3rd harmonic is slightly depressed, with then the 5th, 9th, 11th, and 15th harmonics boosted in level, particularly the 11th at 5500Hz.
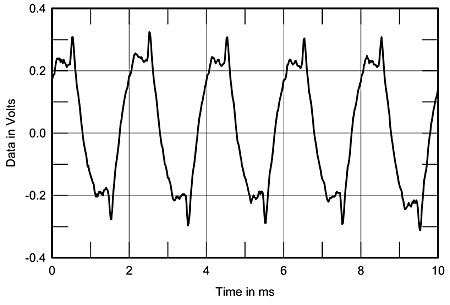
Fig.5 MartinLogan Sequel II, best 500H squarewave response.
Returning to the frequency-domain measurements, fig.6 shows the Sequel's in-room spectral response, assessed with pink noise and an Audio Control Industrial SA-3050A 1/3-octave analyzer using its calibrated microphone. The term "spatially averaged" in the caption refers to the fact that I try to get a measure of the integration between the loudspeaker-under-test's direct sound and the way in which it excites the room's reverberant field by taking nine separate spectral measurements independently for left and right speakers over a spatial window 6' wide, ranging from 30" and 45" high, which is centered on the listening position. Averaging the 18 spectra (with a slight weighting given to the listening-position measurements) gives a curve that has proved, on a relative basis, to correlate quite well with the sonic signature of the test loudspeaker.
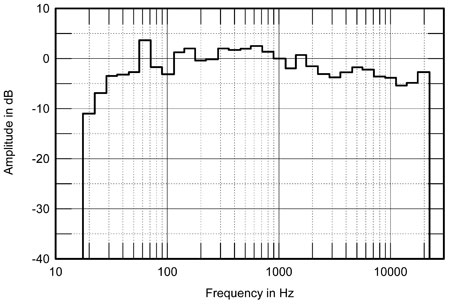
Fig.6 MartinLogan Sequel II, spatially averaged, 1/3-octave response in JA's Santa Fe listening room.
This set of measurements was taken with the Sequels some 5' in front of the record-cabinet–faced rear wall. Apart from a slight excess of energy in the lower midrange, from 160Hz to 800Hz (broken up by a dip at 200Hz), the response is very smooth, though with a slight downward trend in the treble, as implied by fig.3. (If you superimpose the calculated anechoic response in fig.3 and the in-room response, the envelope of the former coincides very nicely with the latter.) Low frequencies can be seen to extend to 30Hz, though the entire bass region seems a little light in balance. (The Sequel's bass control was set to "0dB" for all the measurements.) The slight notch in the 1250Hz region, which I conjectured in the discussion of the fig.3 curve was an interference effect, is visible. There is also the suggestion of slightly too much energy in the 7–8kHz and 16kHz regions.
To investigate further, I looked at the individual driver responses, which are shown in fig.7. This is a composite of the woofer's nearfield response and the electrostatic panel's response at a 1m measuring distance, taken on the listening axis 36" from the ground. Deciding on the relative amplitudes of the two drivers is not trivial; I decided in the end to arrange it so that the 6dB-down point of each lies at the crossover frequency, 250Hz. The woofer, if anything, is slightly overdamped, though its –6dB point with respect to its maximum level at 100Hz still lies at a low 29Hz. (Switching the control to "–3dB" does indeed reduce the driver's output in its passband by 3dB.) The woofer's ultimate low-pass roll-off is 12dB/octave, though the complementary high-pass acoustic roll-out of the electrostatic panel can be seen to be much steeper. The 12dB/octave crossover slope adds to the LF panel cancellation to give something akin to 24dB/octave below 250Hz. This may well correlate with the subjective impression of a rather lean tonal balance in this region.
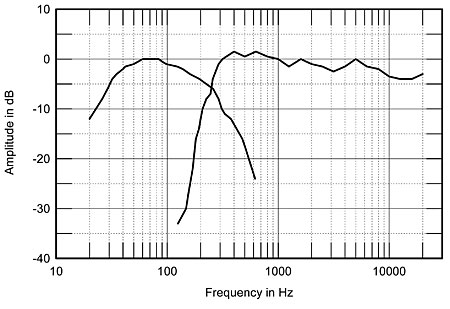
Fig.7 MartinLogan Sequel II, acoustic crossover on listening axis.
Investigating the polarity of the individual driver connections with a raised-cosine pulse proved interesting, and suggested a more direct reason for this balance. With 12dB/octave slopes, conventional wisdom has it that the drivers have to be connected with opposing polarities if there is not to be an on-axis cancellation between their outputs in the crossover region. Yet it appears that the woofer and the electrostatic panel in the Sequel are connected with the same polarity, which would correlate with the lack of crossover-region energy in fig.3. To make sure that I was not mistaken, I repeated the test with a unidirectional rectangular pulse. The drivers still appeared to be connected in phase. The Sequel II's step response on an axis halfway up the electrostatic panel is shown in fig.8. The initial positive-going, sharply defined spike is the step response of the elctrostatic panel; the second, positive-going, but less sharply defined step is the woofer's output.
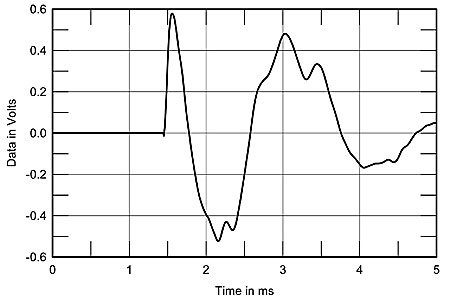
Fig.8 MartinLogan Sequel II, step response on tweeter axis at 50" (5ms time window, 50kHz bandwidth).
MartinLogan has been rather clever with this crossover arrangement, however, as the axis featuring the cancellation notch is actually above the head of a seated listener at a typical listening distance of 3m or so. With my favorite chair placing my ears 36" above the ground, this corresponds to the exact axis where the cancellation due to the in-phase driver connections is at its minimum, ie, the transition is at its smoothest. Standing up, however, or sitting in a high enough seat to bring your ears 40" or more above the ground, will give a deep null in the Sequel's response (this, peculiarly, centered on 175Hz rather than on the crossover frequency of 250Hz). It does imply, however, that the room reverberant field will have a lack of energy in this region, which again might correspond with the subjective feeling of a lightweight bass balance. (This lack is only slight in the fig.8 curve, however.)
Performing a Discrete Fourier Transform calculation on the response of the electrostatic panel to the raised-cosine impulse confirmed the lack of energy in the 1300Hz region, which also can be seen in fig.8. This curve also suggests a gently rolled-off treble, relieved only by an on-axis rise in the top octave. This can be somewhat ameliorated by listening slightly off-axis, but although the correct balance between penultimate and top HF octaves is sensitive to the exact degree of toe-in, I preferred the HF balance with the speakers firing at the listening position. Overall, the responses shown in fig.8 do reinforce the idea of a slight lower-midrange dominance to the Sequel's tonal balance, with a shelved-down bass.—John Atkinson
NEXT: Sam Tellig »
|
|
| ||||||||||
- Log in or register to post comments


| Loudspeakers Amplification Digital Sources | Analog Sources Accessories Featured | Music Columns Retired Columns | Show Reports | Features Latest News Community | Resources Subscriptions |
 © 2024 Stereophile
AVTech Media Americas Inc., USA
All rights reserved

