| Columns Retired Columns & Blogs |
MartinLogan Quest Z loudspeaker Measurements
Sidebar 3: Measurements
Footnote 1: I suspect that it is due to the local "drumhead resonance" of the panel segment. As the panel is divided into many different-area segments, the resonance of each will be different, resulting in a much lower Q for the speaker as a whole.—John Atkinson
Despite the Z modification making the Quest easier to drive, it's still a demanding load for an amplifier, the impedance dropping to 2.7 ohms in the midbass and lower midrange and dropping below 2 ohms above 16kHz (fig.1). The minimum value is a punishing 1.4 ohms at 25kHz—fortunately, there is no high-level musical information up there. Note the moderate phase angle, however, which ameliorates matters. With the bass set to –5dB, the impedance does become a little kinder in the bass, staying above 4 ohms below 160Hz. The woofer tuning is revealed by the peak at 32Hz. The Quest's B-weighted sensitivity appeared to be in the region of 85dB/W/m, which is significantly lower than specified.
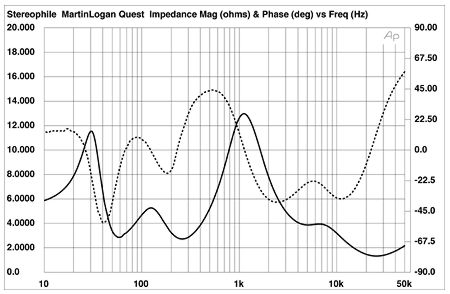
Fig.1 MartinLogan Quest Z, electrical impedance (solid) and phase (dashed) with contour switches set to "flat." (2 ohms/vertical div.)
Fig.2 shows the individual responses of the woofer and panel with both controls set to "Flat." The woofer's trace was taken in the nearfield, while the panel trace is a composite of the nearfield response below 355Hz and the quasi-anechoic response at a distance of 45" on an axis level with the center of the panel. Unusually, the woofer seems to have a bandpass response centered higher than its electrical tuning frequency, in the 50–55Hz region. This will still result in reasonably good extension in-room. However, there will be a lack of upper-bass energy resulting from what appears to be a too-early low-pass woofer characteristic and a too-high panel high-pass characteristic. This presumably correlates with DO's listening impression that the speaker was "lean," overall.

Fig.2 MartinLogan Quest Z, anechoic response of electrostatic driver halfway up panel at 45", averaged across 30 degrees horizontal window and corrected for microphone response, with the nearfield responses of the panel plotted below 350Hz and of woofer.
Turning to the panel, it's possible that the narrow peak at 275Hz is a nearfield measurement artifact (footnote 1). The sharp notches at 1.2 and 2.3kHz, too, are presumably due to interference effects at the close measuring distance, and would be inconsequential at a more typical listening distance. Note, however, the panel's steep high-pass rollout below 180Hz and a generally higher level in the midrange than in the treble. The response shelves down by some 10dB from 1kHz to 20kHz, which, on the face of things, will tend to make the speaker sound laid-back, with a rear-of-the-hall presentation. Remember that this, indeed, was what DO found.
In part, however, this measured response trend will be a function of the standard 45" microphone distance that I use. As explained in Martin Colloms's High Performance Loudspeakers textbook (footnote 2), the "proximity effect" comes into play when measuring physically large loudspeakers. With a panel loudspeaker, the necessary assumption that the measuring microphone is in the loudspeaker's far field becomes increasingly invalid with decreasing frequency. For measuring distances that are not very much larger than its panel dimensions, therefore, the response of the Quest will appear tilted down in the treble (above about 1kHz for a 45" distance).
To confirm this hypothesis, I performed a different kind of measurement. The one used to derive the fig.2 traces was performed by feeding the speaker under test what is called a "Maximum-Length Sequence" signal—which sounds like noise—calculating the speaker's impulse response from that signal, windowing out reflections of the impulse from the room boundaries, and calculating the amplitude response using the Fast Fourier Transform algorithm. My alternate technique was to leave the microphone in the same 45" position, feed the speaker with pink noise, and capture just over half a second's worth of the speaker's output. Applying the Fourier Transform to the digital data representing that noise gave the lower power spectrum shown in fig.3. Repeating the measurement with the microphone three times as far away, at 135", gave the upper trace shown in fig.3.

Fig.3 MartinLogan Quest Z, 1/5-octave–smoothed in-room responses at 45" (bottom) and at 135" (top).
The difference between these curves will be to some extent due to the different effects of the room at the two microphone positions, particularly in the midrange and below. (Both are 1/5-octave smoothed to minimize the effects of room resonances.) Nevertheless, as predicted, moving the microphone back to three times its normal distance brings up the Quest's mid-treble level by up to 6dB. Both curves, however, still shelve down above 4kHz, and the farther-away spectrum has significantly less top-octave energy.
I assume that such proximity-effect changes apply to the ear as much as they do to a microphone. If you do listen to the Quests in a small room, therefore, setting the speakers' presence switches to "+2dB" will add a mild presence-region hump to the on-axis response (fig.4), exactly as specified, which will slightly counteract the proximity effect.

Fig.4 MartinLogan Quest Z, effect of presence control, assuming flat on-axis response.
Turning to dispersion, fig.5 shows the manner in which the Quest's response changes as the listener moves to the speaker's side. (Just the changes are shown, which means that the on-axis response is represented as a straight line.) The entire treble region stays in balance up to 60 degrees to the speaker's side, but increasingly shelves down past the 15 degrees angle. At 15 degrees laterally off-axis—the limits of the speaker's specified 30 degrees dispersion window—there is a little more high-treble energy and a little less presence energy than directly on-axis. The way in which the Quest's balance changes for differences in listener height is shown in fig.6. Although the treble only changes in a minor way as long as the listener's ears are between 36" and 63" from the ground, a suckout appears in the midrange for listeners who are significantly above or below the center-point of the panel, which is a high 48" from the floor.

Fig.5 MartinLogan Quest Z, lateral response family at 45", normalized to response on mid-panel axis, from back to front: differences in response 90–5 degrees off-axis, reference response, differences in response 5–90 degrees off-axis.

Fig.6 MartinLogan Quest Z, vertical response family at 45", normalized to response on mid-panel axis, from back to front: differences in response 15–5 degrees above axis, reference response, differences in response 5–15 degrees below axis.
In the time domain, the Quest's impulse response (fig.7) has a good time-coherent shape, but its tail is confused by ringing at both high and low frequencies. The step response calculated from this impulse (fig.8) has a good right-triangle shape, but, again, with low-frequency ringing very noticeable. (Although the woofer is connected with the same acoustic polarity as the panel, its passband is too low in frequency for its output to be visible in this 30kHz-bandwidth graph.)

Fig.7 MartinLogan Quest Z, impulse response on mid-panel axis at 45" (5ms time window, 30kHz bandwidth).

Fig.8 MartinLogan Quest Z, step response on mid-panel axis at 45" (5ms time window, 30kHz bandwidth).
Finally, the "waterfall" (or cumulative spectral-decay) plot calculated from the impulse response (fig.9) is typical of a panel speaker in that it shows a multitude of overhang problems in the treble, as well as some serious resonant modes at 1065Hz and 2220Hz.
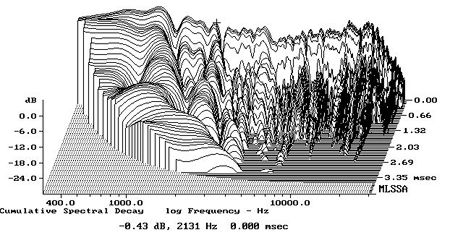
Fig.9 MartinLogan Quest Z, cumulative spectral-decay plot at 45" (0.15ms risetime).
How audible will these problems be? That is the $64,000 question, not just for the Quest but for all panel speakers, all of which tend to produce messy-looking waterfall plots. A large, uniformly driven, low-mass diaphragm seems to exhibit chaotic behavior; ie, adjacent small sections of the diaphragm don't move identically. In effect, while the diaphragm's average position moves uniformly in response to the driving force, there will always be small areas which move more than the average and others that move less, giving rise to hashy-looking waterfall plots. The ear, in these instances, must be the arbiter, such behavior having to be put against the absence of enclosure resonances and the better surface-loudness (or intensity) match with real sound sources. Certainly DO was mightily impressed with the overall sound of the Quest, which suggests that fig.9 is unduly pessimistic.—John Atkinson
Footnote 1: I suspect that it is due to the local "drumhead resonance" of the panel segment. As the panel is divided into many different-area segments, the resonance of each will be different, resulting in a much lower Q for the speaker as a whole.—John Atkinson
Footnote 2: Fourth Edition, pp.148-150, published by Halsted Press, a division of John Wiley & Sons. Available from Old Colony Sound Lab Book Service, P.O. Box 243, Peterborough, NH 03458-0243. Website.—John Atkinson
|
|
| ||||||||||
- Log in or register to post comments


| Loudspeakers Amplification Digital Sources | Analog Sources Accessories Featured | Music Columns Retired Columns | Show Reports | Features Latest News Community | Resources Subscriptions |
 © 2024 Stereophile
AVTech Media Americas Inc., USA
All rights reserved

