| Columns Retired Columns & Blogs |
Thank You! LG-
this integrated is on my short list to demo. I would really be interested in reading about mating this amp w/ the ML No. 512
CD/SACD spinner!
I measured the Mark Levinson No.585 using my Audio Precision SYS2722 system (see the January 2008 As We See It"). As usual, before measuring the amplifier I preconditioned it by running both channels at one-third power into 8 ohms for an hour. However, the No.585 turned its output off after 35 minutes, its front panel displaying "Over Temperature." The top panel was hot, at 115.4°F (46.4°C), and the heatsinks even hotter, at 149.8°F (65.4°C). I unplugged the amplifier from the wall and let it cool down, after which I could turn it on again and continue testing.
I looked first at the performance of the digital inputs, using the setup menu to disable the power-amp section and set the line output level to Fixed. I used both S/PDIF TosLink data from the Audio Precision SYS2722 and USB data from my MacBook Pro running on battery power. Apple's USB Prober utility identified the No.585 as "USB2.0 High-Speed True HD Audio" from "HARMAN" and indicated that the No.585's USB input operated in the optimal isochronous asynchronous mode. The USB port operated at all sample rates from 44.1 to 192kHz.
Full-scale data at 1kHz gave rise to a signal level of 5.16V at the fixed Line outputs, while with the volume control set to its maximum, the amplifier's speaker outputs were close to clipping with a 1kHz signal at –20dBFS. As each input's maximum gain can be set independently, it would be a good idea to reduce the amount of gain for the No.585's digital inputs in order to be able to use the volume control over a sensible range. The digital inputs preserved absolute polarity at the Line output when set to Non-Inverting, but inverted polarity at the speaker outputs. I didn't test the Clari-Fi feature because I wasn't sure how to do so in an effective manner.
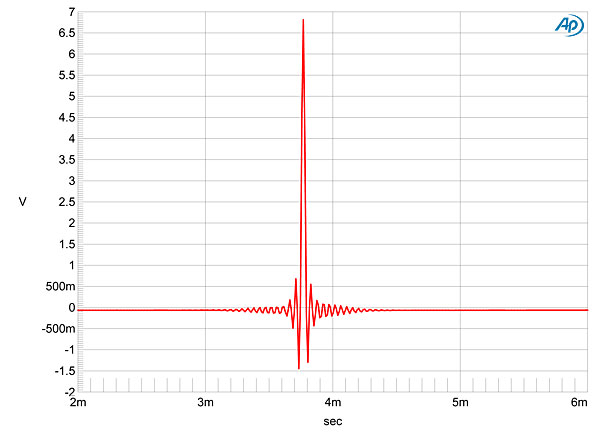
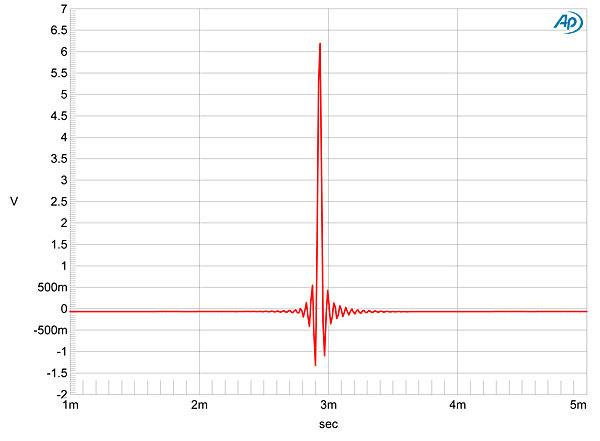
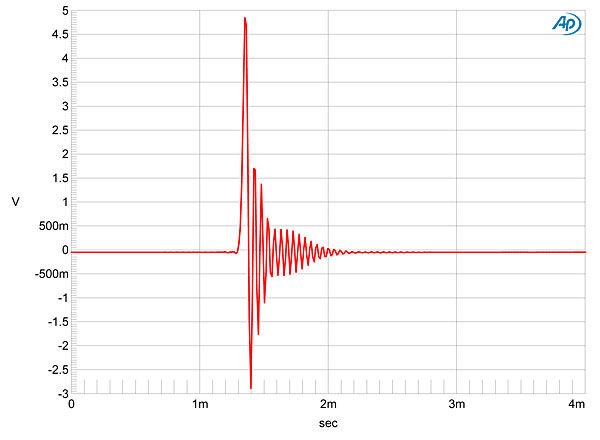
The digital input's impulse response varied according to the reconstruction filter selected. With the filter set to Fast, the impulse response was a conventional, time-symmetrical type (fig.1). The Slow filter's impulse response was similar, but with fewer coefficients (fig.2), while with the Minimum Phase filter, all ringing followed the impulse, as expected (fig.3).
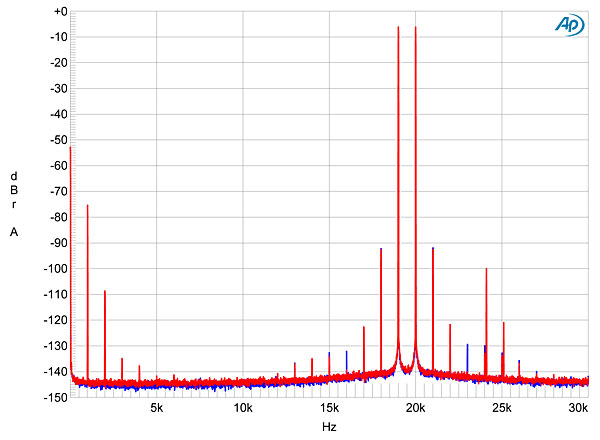
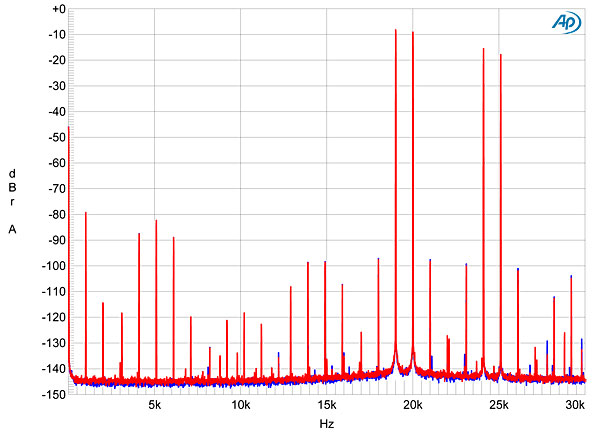
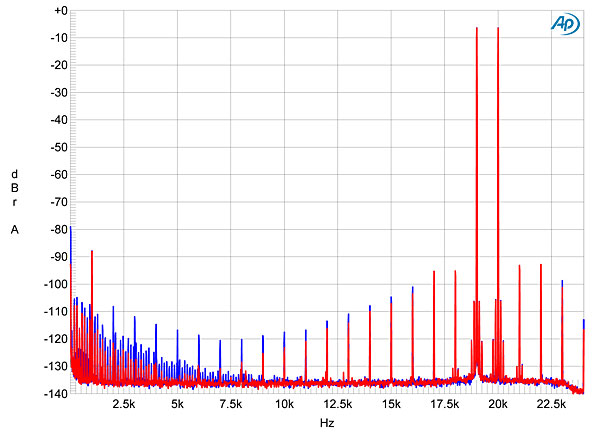
Tested with white noise sampled at 44.1kHz (fig.4, red and magenta traces), wideband spectral analysis (footnote 1) revealed that both the Minimum Phase and Fast filters rolled off the output very rapidly above half the sample rate (fig.4, vertical green line), with maximum attenuation reached between 23 and 24kHz. The aliased image at 25kHz of a full-scale 19.1kHz tone is therefore suppressed by 115dB (blue and cyan traces). However, the distortion harmonics associated with this tone are higher than usual, the second harmonic at 38.1kHz lying at –70dB (0.03%). With the Slow filter, the white noise begins to roll off in the top audio octave (fig.5), the aliasing tone at 25kHz is suppressed by only 12dB, and many other aliasing products are visible.
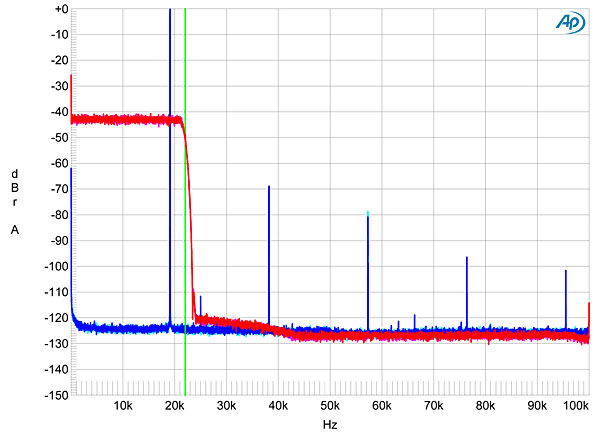
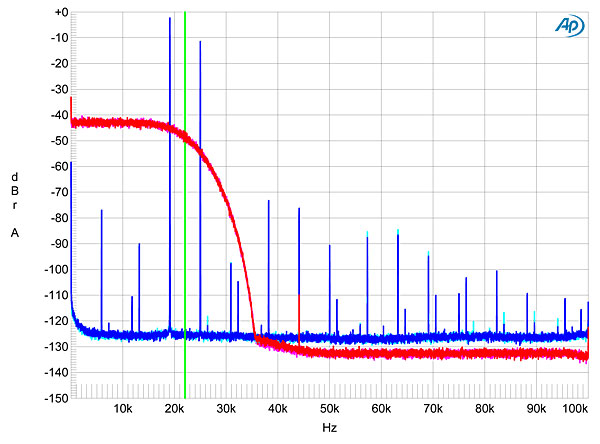
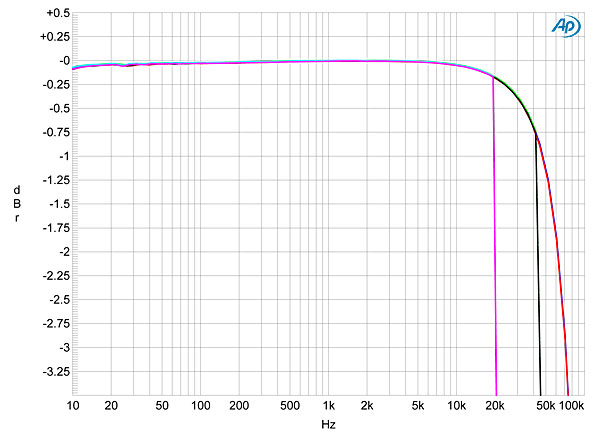
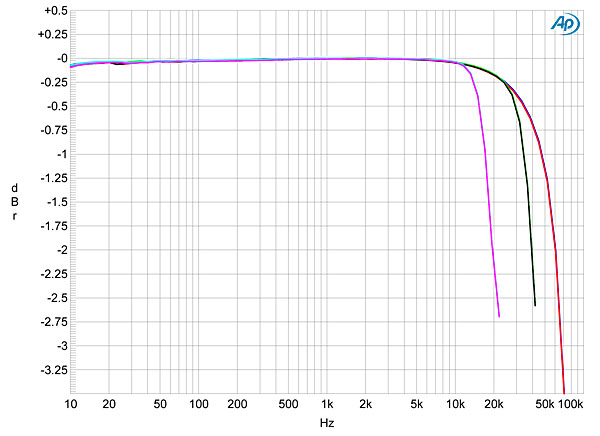
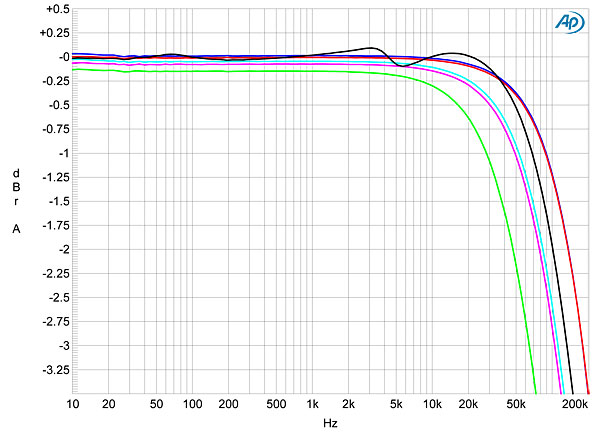
Fig.6 shows a more conventional frequency-response graph with the Fast filter, taken with data sampled at 44.1, 96, and 192kHz. The overall response conforms to the same basic shape at all three sample rates, with a sharp rolloff just below half the rate at 44.1 and 96kHz. While the Minimum Phase frequency responses were identical, the Slow filter gave a slower rolloff at all three sample rates (fig.7), with the 44.1kHz response down by 2dB at 20kHz. Channel separation at 1kHz was superb, at >120dB in both directions below 2kHz.
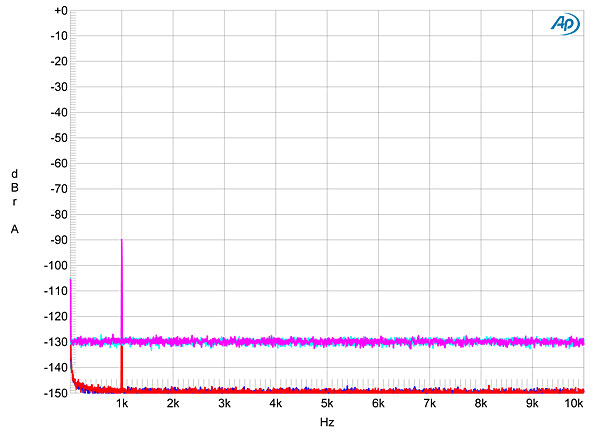
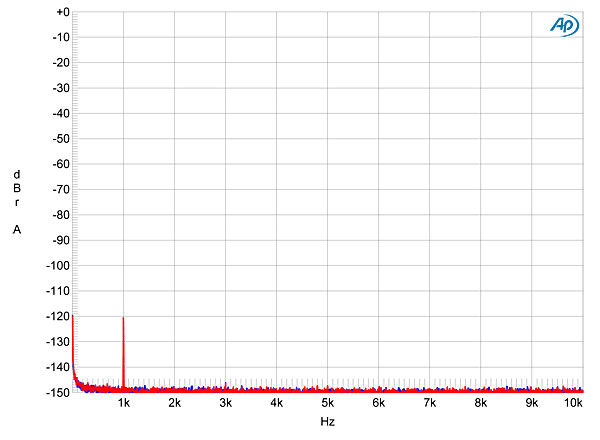
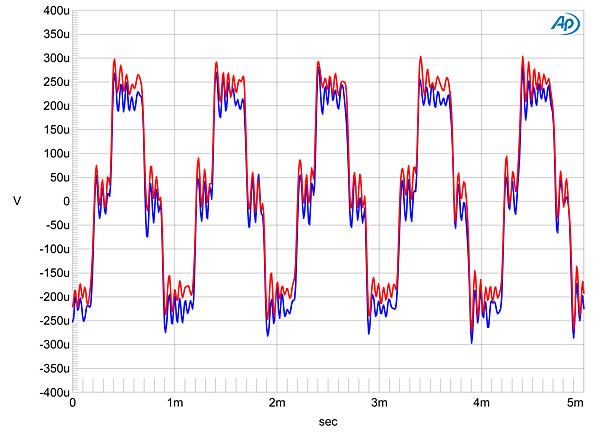
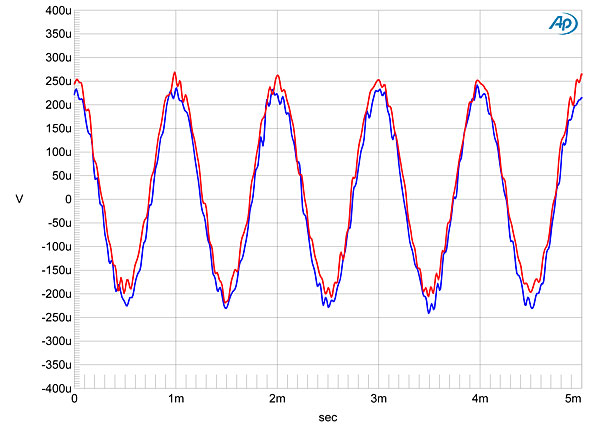
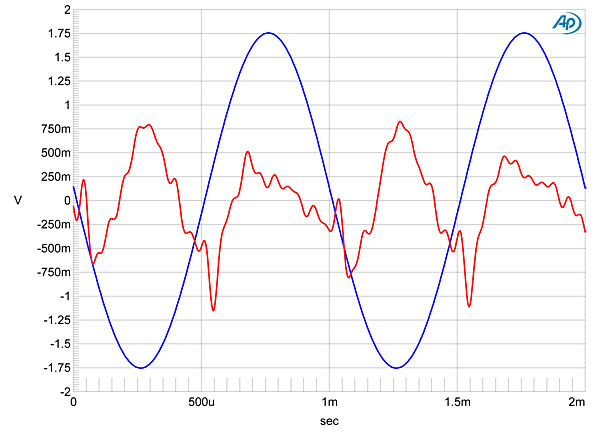
Fed dithered data representing a 1kHz tone at –90dBFS with first 16-bit data (fig.8, cyan and magenta traces), then 24-bit data (blue, red), the increase in bit depth dropped the noise floor by around 20dB, suggesting resolution of at least 19 bits. No spuriae can be seen with 24-bit data, and repeating this test with USB data (fig.9) revealed that the No.585 correctly handled 24-bit data via this input. With its high resolution and very low noise, the No.585 reproduced undithered 16-bit data describing a sinewave at exactly –90.31dBFS in exemplary manner (fig.10), with zero DC offset, the three DC voltage levels well differentiated, and with the Minimum Phase filter characteristic clearly evident. With undithered 24-bit data, the No.585 output a well-formed sinewave despite the very low signal level (fig.11).
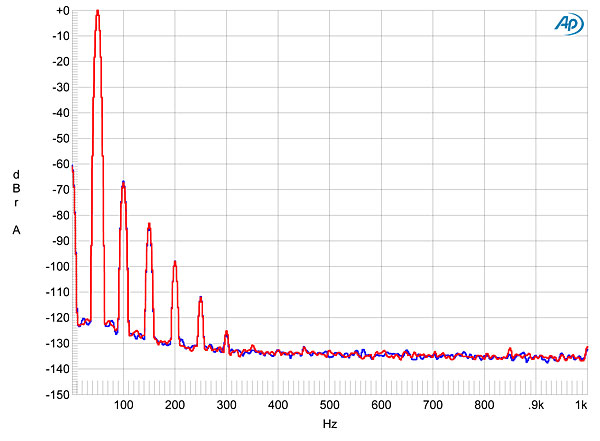
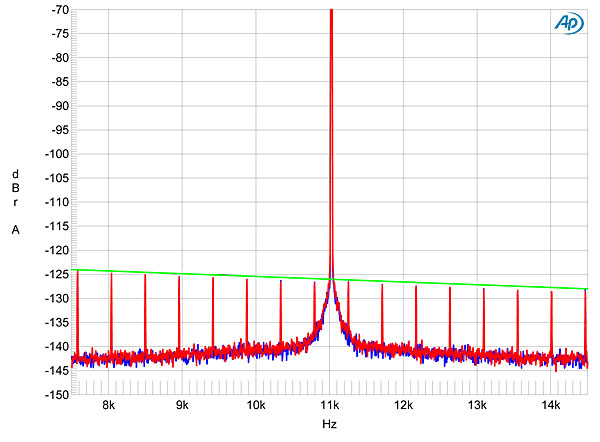
Correlating with fig.3, full-scale data at 50Hz produced a second-harmonic component just above –70dB (fig.12), though dropping the signal level by 10dB reduced the level of all distortion harmonics by 20dB. Tested with an equal mix of 19 and 20kHz tones, the Levinson's intermodulation distortion with the Fast and Minimum Phase filters was low (fig.13), though the Slow filter introduced a slew of aliasing products (fig.14). Other than some spectral spreading around the spike that represents the high-level tone at one-quarter the sample rate (fig.15), all the odd-order harmonics of the low-frequency, LSB-level squarewave with 16-bit J-Test data were reproduced at the correct level, as indicated by the green line in this graph.
The No.585's analog inputs offered a maximum gain of 40.9dB for both balanced and unbalanced signals, this the norm for an integrated amplifier, and inverted the signal polarity, again with the amplifier set to Non-Inverting. The input impedance was the same for balanced and unbalanced signals, at 44k ohms at 20Hz and 1kHz, dropping inconsequentially to 37.5k ohms at 20kHz. The volume control operated in steps of close to 0.2dB, each displayed reduction by "10" accompanied by a reduction in gain of 10dB.
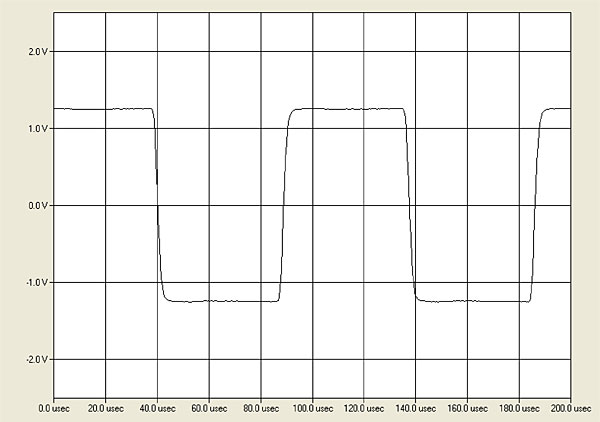
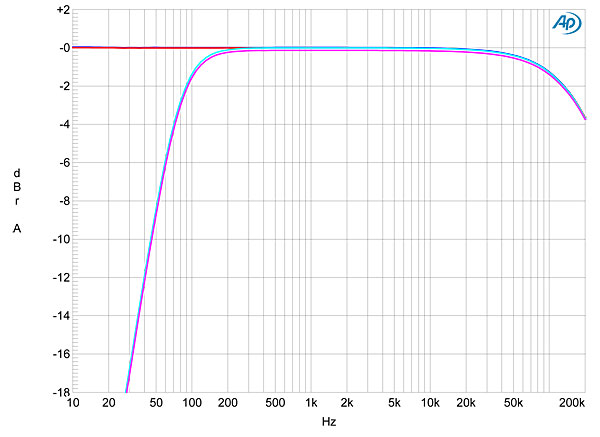
The output impedance at low and middle frequencies (including 6' of speaker cable) was low, at 0.07 ohm, rising to 0.16 ohm at the top of the audioband. The variations in the No.585's frequency response with our standard simulated loudspeaker were therefore very small (fig.16, gray trace). Fig.16 indicates that the No.585's small-signal response is very wide, the –3dB point lying at 190kHz. As a result, the amplifier's reproduction of a 10kHz squarewave featured very short risetimes but no overshoot or ringing (fig.17). Fig.16 was taken with the volume control set to its maximum of "80." Repeating the measurement with it set to "60" (ie, –20dB) commendably gave an identical result (fig.18). This graph also shows the response with the high-pass filter activated. The output is down by 3dB at 80Hz and by 10dB at 45Hz.
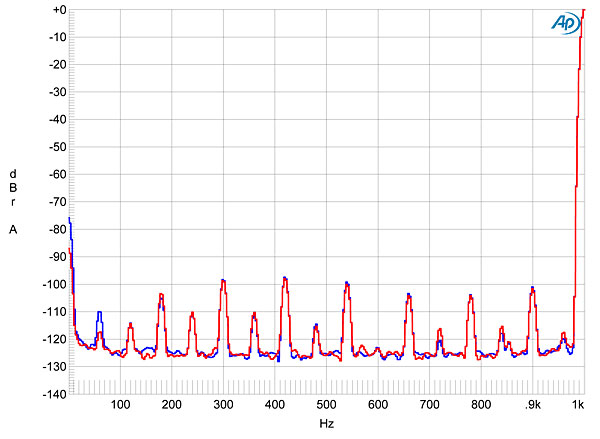
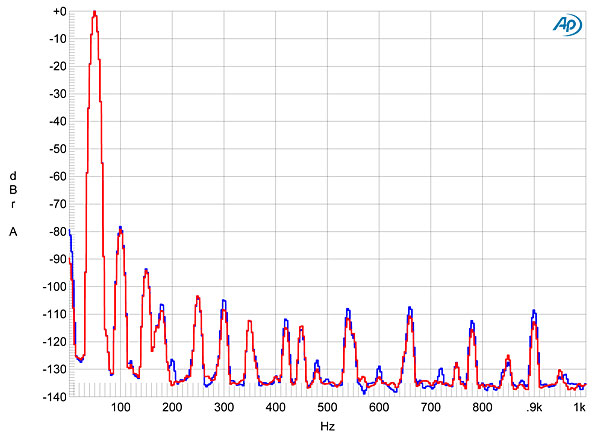
Channel separation via the analog inputs was excellent, at 100dB in both directions below 10kHz. The wideband, unweighted signal/noise ratio, ref 2.83V and taken with the unbalanced input shorted to ground but the volume control set to its maximum—very much the worst case—was moderate, at 72.75dB. The ratio improved by 10dB when the measurement bandwidth was restricted to the audio band and by another 2dB when A-weighted. Spectral analysis (fig.19) revealed that the primary noise components were odd-order harmonics of the AC supply, perhaps due to magnetic interference from the amplifier's massive toroidal transformer.
Specified at 200Wpc into 8 ohms (23dBW), the No.585 exceeded this power output by 1dB, clipping at 250Wpc into 8 ohms with both channels driven (fig.20). Into 4 ohms with both channels, the Levinson clipped at 390Wpc (22.9dBW, fig.21), though it is fair to note that the wall voltage had dropped from 122V AC with the amplifier quiescent to 117.5V AC at the clipping point into this load. When I repeated the test into 2 ohms with one channel driven, the No.585 turned itself off at 395W (fig.22), its front panel displaying "Over Current." Again, unplugging the amplifier from the wall restored it to normal operation.
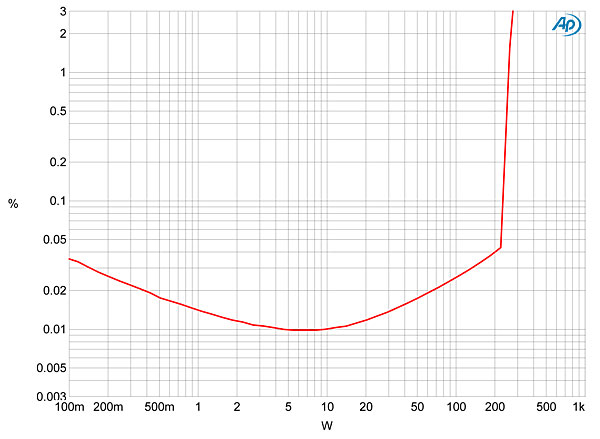
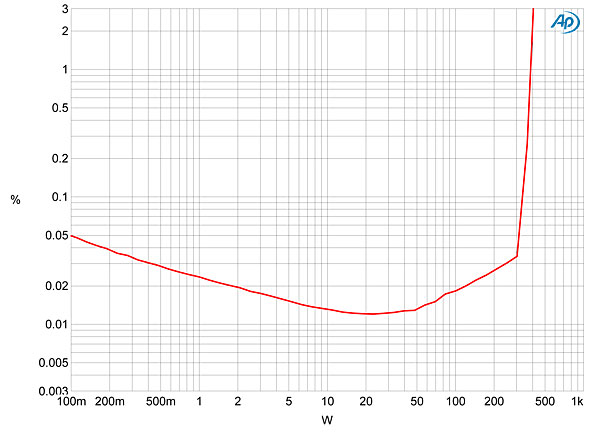
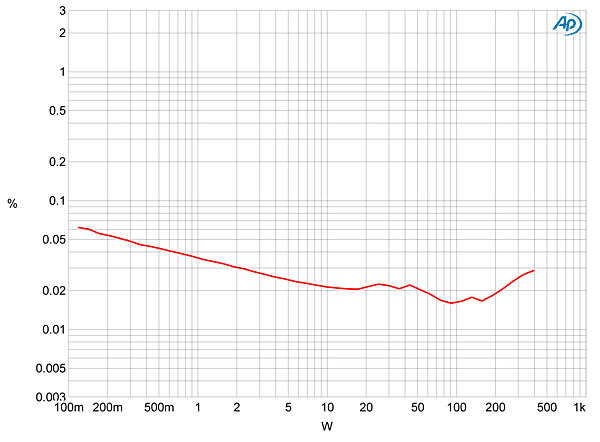
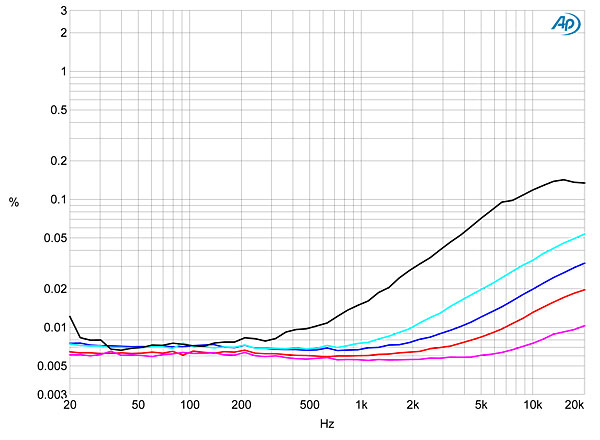
I plotted how the percentage of THD+noise changed with frequency at a level, 12.65V, equivalent to 20W into 8 ohms, 40W into 4 ohms, and 80W into 2 ohms, where I should be looking at actual distortion rather than noise. Even so, into 8 and 4 ohms there was only a slight rise above 2kHz, though it was greater into 2 ohms (fig.23). The THD+N waveform (fig.24) suggested that the distortion was predominantly the benign second harmonic, which was confirmed by spectral analysis (fig.25), with the second harmonic lying at –80dB (0.01%) at high powers. Intermodulation distortion (fig.26) was also very low: the difference component at 1kHz resulting from an equal mix of 19 and 20kHz tones at a level a couple of dB below clipping into 4 ohms lay just above –90dB (0.003%).
The Mark Levinson No.585 offers impressive measured performance. I am not surprised that Larry Greenhill liked it as much as he did.—John Atkinson
|
|
| ||||||||||

Thank You! LG-
this integrated is on my short list to demo. I would really be interested in reading about mating this amp w/ the ML No. 512
CD/SACD spinner!
John,
Thanks for the review.
Do you have the jitter spectrum graph taken for the USB input? Also, it'd be nice to see the same graph with 24 bit data? At this price point, I'd expect the Levinson to handle jitter better. Based on the graph, It seems they are relying strictly on the chipset to do manage the jitter.
Thanks for your feedback!
A "professional" audio reviewer using a subwoofer ?? Bel Canto ? Bryston ? And electrostatic speakers for transistorized amps ?? Oh wow ! I must be missing something.
Also, Silverstone, even a $499 DAC these days will not let you hear the so-called "jitter". Try the Chord Electronics Mojo amd, you'll know what i'm talking about


| Loudspeakers Amplification Digital Sources | Analog Sources Accessories Featured | Music Columns Retired Columns | Show Reports | Features Latest News Community | Resources Subscriptions |
 © 2024 Stereophile