| Columns Retired Columns & Blogs |
Mark Levinson No.390S CD Processor Measurements
Sidebar 3: Measurements
Footnote 1: The difference in the waveform shapes of these two graphs is due to the external data lying at not exactly the same level. But the absence of discrete voltage levels between those at the 16-bit LSB, which should make this waveform look like a sinewave, is clearly evident.—John Atkinson
I measured sample 1671 of the No.390S, and repeated some of those tests with sample 1563. The Levinson's maximum output level was 2.18V from the unbalanced RCA jacks, this doubling to 4.36V from the balanced XLRs, as expected. The player preserved absolute polarity from both sets of outputs, the XLRs being wired with pin 2 hot. Error correction was among the best I have encountered, the Levinson coping with gaps in the CD data spiral of up to 1.75mm in length without audible glitches. The output impedance was very low, at 24 ohms unbalanced, 27 ohms balanced, though this is higher than specified.
With CD playback, the No.390S's audioband response was flat, with the usual slight droop apparent in the top octave (fig.1, top pair of traces). De-emphasis error was negligible (fig.1, bottom traces). Unfortunately, I couldn't assess the '390S's frequency response with high-resolution audio data because I couldn't get its S/PDIF input to lock on to a datastream sampled higher than 48kHz. (This was true of both samples.) Channel separation, however, was superb, at better than 115dB below 10kHz from either set of outputs (not shown).
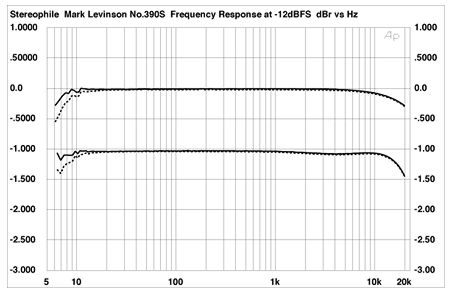
Fig.1 Mark Levinson No.390S, CD frequency response at -12dBFS into 100k ohms, with de-emphasis (bottom) and without (top). (Right channel dashed, 0.5dB/vertical div.)
The top pair of traces in fig.2 shows a spectral analysis of the No.390S's left and right outputs while it decoded CD data representing a dithered 1kHz tone at -90dBFS. The spectrum peaks at exactly -90dB, implying excellent linearity, while the noise floor—almost entirely due to the recorded dither—is free from power-supply- or distortion-related spuriae. However, I also drove the No.390S's data input with 24-bit data representing the same signal; the result is shown in the lower pair of traces in fig.2. Usually, the increase in bit depth drops the noise floor, revealing the component's true resolution. This is true for the part of the spectrum below the signal frequency, where the noise floor drops by 9dB or so, implying DAC performance close to 18 bits. But above the 1kHz signal frequency, peaks appear at 3kHz, 5kHz, 9kHz, 15kHz, and 18kHz. The only possible interpretation of these odd-order distortion components is that the No.390S truncates external data to 16 bits.
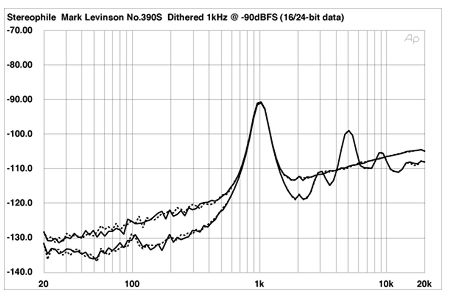
Fig.2 Mark Levinson No.390S, 1/3-octave spectrum of dithered 1kHz tone at -90dBFS, with noise and spuriae, 16-bit CD data (top) and external 24-bit data (bottom). (Right channel dashed.)
Linearity error with CD data was superbly low to below -110dBFS (fig.3), with most of the error below that level due to the recorded dither noise. With its low noise and excellent linearity, the Levinson's reproduction from CD of an undithered 1kHz sinewave at exactly -90.31dBFS was superb (fig.4), with excellent waveform symmetry and the three DC voltage levels described by this signal clearly evident. However, feeding the S/PDIF input 24-bit data representing the same signal resulted in a very similar waveform (fig.5, footnote 1), which again suggests that the hi-rez audio data are being truncated to 16 bits before being fed to the No.390S's DACs.
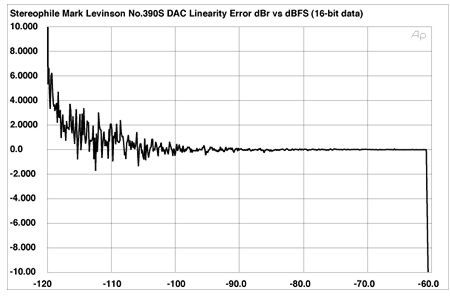
Fig.3 Mark Levinson No.390S, right-channel departure from linearity, 16-bit CD data (2dB/vertical div.).
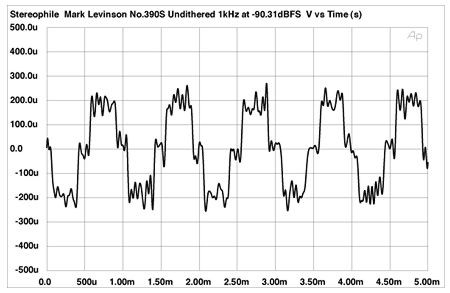
Fig.4 Mark Levinson No.390S, waveform of undithered 1kHz sinewave at -90.31dBFS, 16-bit CD data.
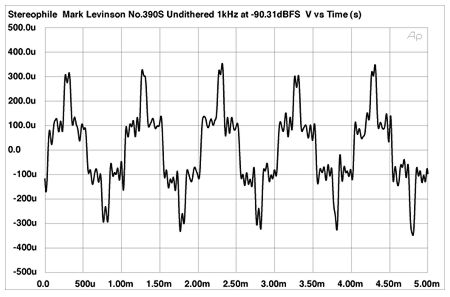
Fig.5 Mark Levinson No.390S, waveform of undithered 1kHz sinewave at -90.31dBFS, 24-bit external data.
The No.390S's analog output stage was bombproof, producing just 0.0009% THD in the left channel, 0.0006% in the right when driving a full-scale 1kHz tone into 8k ohms (fig.6). The second harmonic was the highest in level in the left channel, at -101dB, while the third was the highest in the right (-108dB). Dropping the load impedance to a demanding 600 ohms increased the level of the third harmonic to -90dB, though this will still be inconsequential, subjectively. Intermodulation distortion was also very low, even into 600 ohms (fig.7).
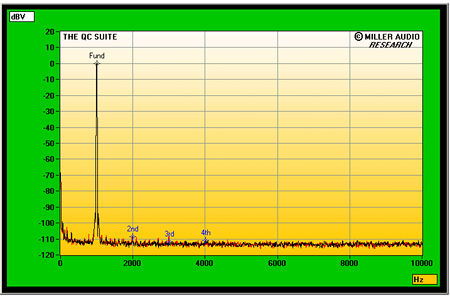
Fig.6 Mark Levinson No.390S, unbalanced output, spectrum of 1kHz sinewave, DC-1kHz, at 0dBFS into 8k ohms (linear frequency scale).
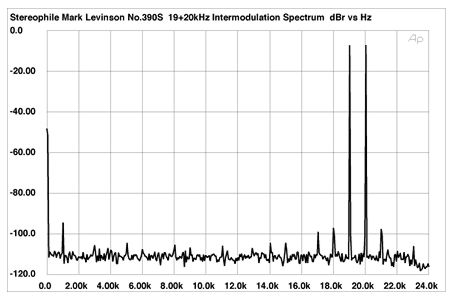
Fig.7 Mark Levinson No.390S, unbalanced HF intermodulation spectrum, DC-25kHz, 19+20kHz at 0dBFS into 8k ohms, CD data (linear frequency scale).
The original No.39 CD Processor had one of the lowest word-clock jitter levels I have measured, at 140.2 picoseconds peak-peak The No.390S was almost as good, at 156ps, the small increase due to higher levels of the low-frequency sidebands at ±15.6Hz compared with the No.39 (fig.8, purple "1" markers). Data-related sidebands (red numeric markers) are about the same as with the No.39. Two low-level sidebands at ±572Hz also make an appearance (purple "6"); again, similar behavior to the No.39's.
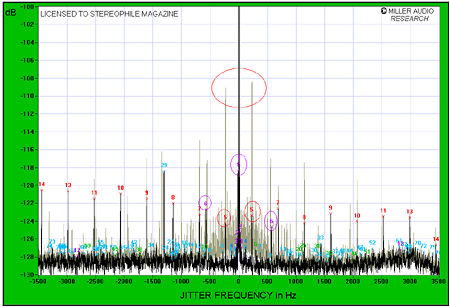
Fig.8 Mark Levinson No.390S, unbalanced output, CD data, high-resolution jitter spectrum of analog output signal (11.025kHz at -6dBFS sampled at 44.1kHz with LSB toggled at 229Hz). Center frequency of trace, 11.025kHz; frequency range, ±3.5kHz. (Grayed-out trace is external TosLink data.)
Repeating the jitter analysis with external data fed from my PC's RME soundcard via a TosLink connection raised the measured jitter level to a still low 212ps, most of the increase resulting from two strong sidebands at the signal-related frequency of ±229Hz (fig.8, grayed-out trace, red circle). However, a plateau of low-frequency, harmonically related spuriae appears on either side of the central tone. I doubt that this behavior is audible in itself, but it might be related to the truncation I noted earlier.
For CD playback, the No.390S offers state-of-the-art measured performance. However, its external input is not transparent to high-bit-depth data, suggesting inadequate implementation of either the receiver circuit or the circuitry downstream of it.—John Atkinson
Footnote 1: The difference in the waveform shapes of these two graphs is due to the external data lying at not exactly the same level. But the absence of discrete voltage levels between those at the 16-bit LSB, which should make this waveform look like a sinewave, is clearly evident.—John Atkinson
|
| ||||||||||
- Log in or register to post comments


| Loudspeakers Amplification Digital Sources | Analog Sources Accessories Featured | Music Columns Retired Columns | Show Reports | Features Latest News Community | Resources Subscriptions |
 © 2024 Stereophile
AVTech Media Americas Inc., USA
All rights reserved

